
Summary
- Bitcoin’s total emissions have stayed roughly flat for seven years: 37.8 Mt CO2e/yr in November 2019 and 40.0 Mt CO2e/yr today
- 59% of Bitcoin’s total network emissions are likely already being mitigated.
- On current trends, Bitcoin is projected to go carbon negative between 2031 and 2047.
- This document examines the five factors that are currently contributing to Bitcoin’s mitigated emissions, and the rationale for the 2031-2047 carbon negative projection.
Introduction
Every industry I can think of has one way to reach carbon negative: buy carbon credits, to offset emissions at the layer of accounting without changing the underlying physics. Bitcoin is unique among the industries I am aware of in having numerous possible paths to offset its emissions without needing carbon accounting. I evaluated six and found five with a non-trivial effect, three on the energy side and two on the monetary side. The sixth, Lightning payments replacing card payments, is real and close to zero.
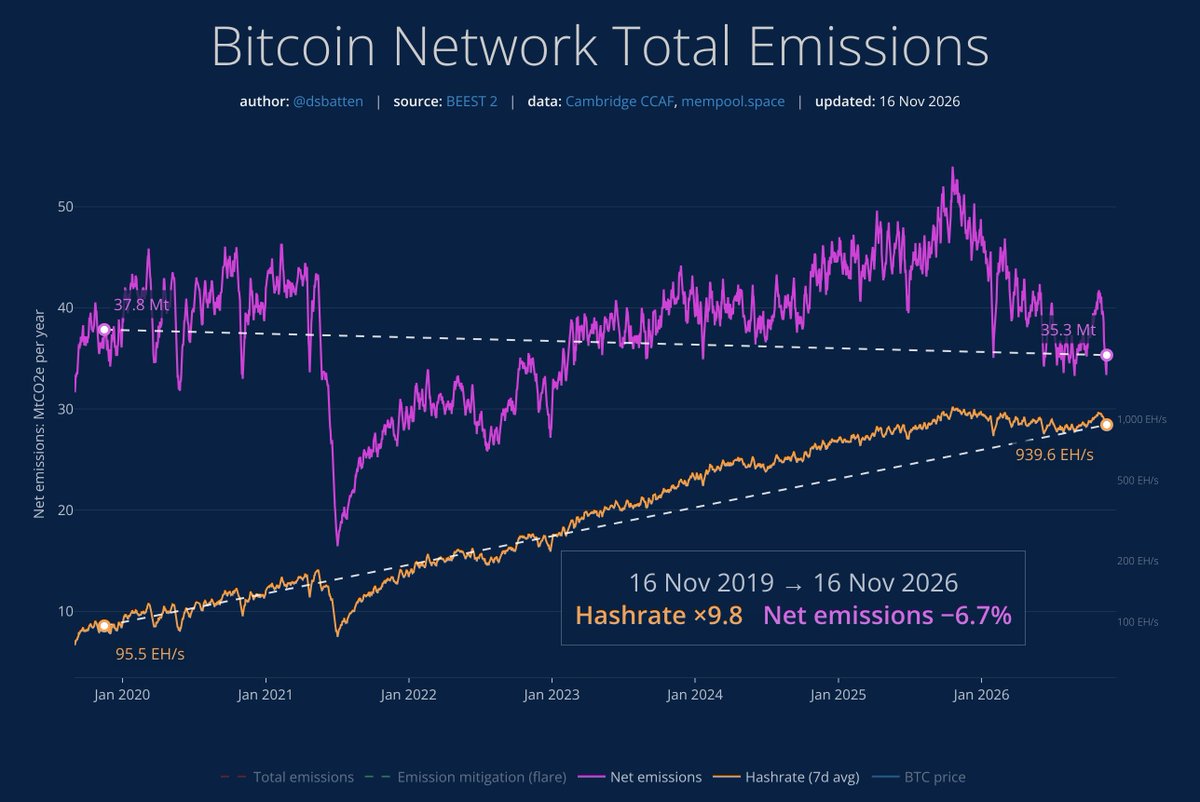
The line each path has to cross is the network’s total emissions. On 16 November 2026 those were 40.0 Mt CO2e a year, a third of what gold mining emits (World Gold Council). The figure comes from BEEST 2, my emissions tracker, which runs the live hashrate from mempool.space through Cambridge’s survey data on the fleet’s efficiency, its energy mix and its flare-gas mitigation (Cambridge Digital Mining Industry Report). Seven years ago the figure was 37.8 Mt; today it is 40.0 Mt, with the price up 7.7 times and the hashrate up 9.8 times in between (BEEST 2 history). That remarkable achievement provides the baseline of static emissions that makes every future path below arithmetic rather than hope.
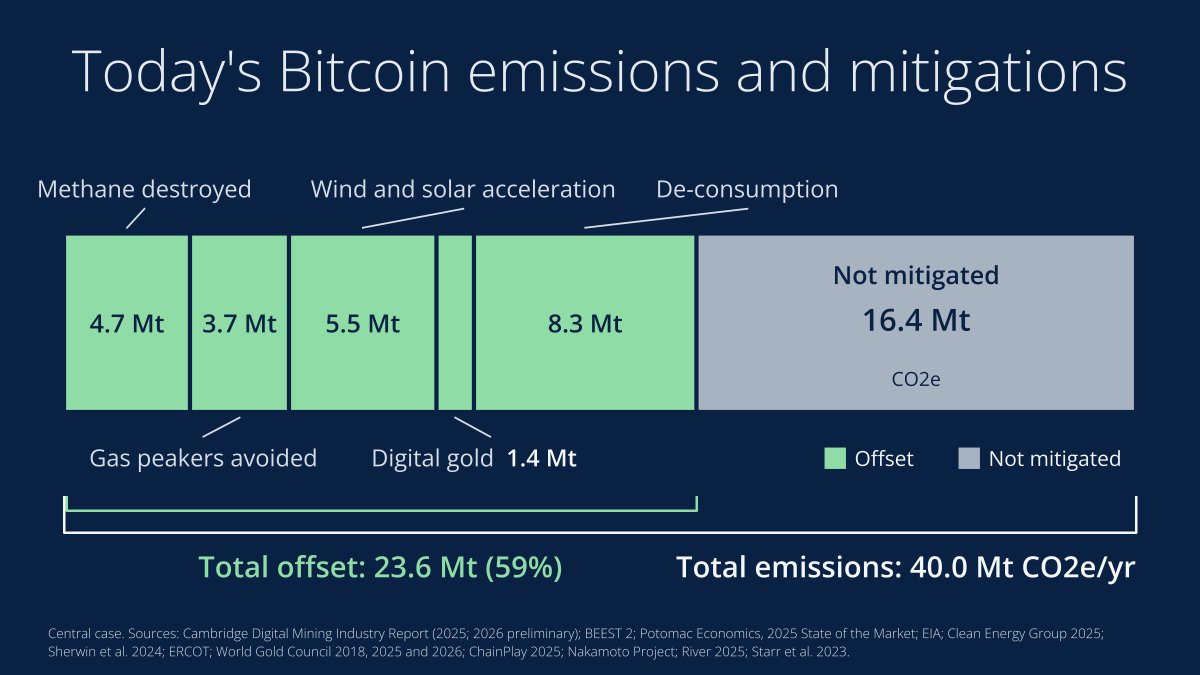
The five paths, with today’s figure on conservative and on central assumptions:
- Methane destroyed at flare sites. Miners run generators on gas that oil wells would otherwise flare, and a generator destroys the methane a flare lets through. Conservative 1.6 Mt a year, on the 100-year warming convention; central 4.7 Mt, on the 20-year convention the tracker uses, which is the horizon 67 leading climate scientists and engineers, Robert Howarth and Michael Mann among them, recommend for methane. The tracker already deducts this 4.7 Mt from the network’s emissions; nothing yet deducts the other four.
- Gas peaker plants not built or run. Texas keeps flexible mining load, which switches off on request, in place of standby gas turbines for its few hundred peak hours a year. Conservative ~1.0 Mt, central 3.7 Mt.
- Wind and solar brought forward. A buyer who is active in the hours when wind and solar would otherwise push the price negative makes new projects viable sooner. Conservative ~0.4 Mt, measured at co-located sites; central 5.5 Mt, in Texas on a 20% attribution.
- Digital gold replacing physical gold. Gold is mined to meet the demand to hold it, and some of the money now held in Bitcoin would otherwise be held in gold. The one survey that asked found 52% of buyers sold gold or stocks to buy Bitcoin; split evenly, that is 26% from gold. Conservative ~1.1 Mt, counting only the three quarters of Bitcoin held as savings; central 1.4 Mt, counting all of it; the ceiling is 5.5 Mt, if every Bitcoin dollar would otherwise be in gold.
- Holder discretionary spend reduction. People who save in an asset with a fixed supply spend less on non-essentials. Conservative ~4.2 Mt, on a 10% cut by 20 million savers; central 8.3 Mt, on a 20% cut.
Together these five paths mitigate 8.3 Mt a year today on the conservative figures, 21% of the total, and 23.6 Mt, 59%, on the central ones. Hold emissions at the level of the last seven years and extrapolate each path on its current trendline, and mitigation overtakes emissions in 2031 on the central case and in 2047 on the conservative one. From the network’s launch in January 2009 that is 22 to 38 years; solar took 57, from the first Bell Labs cell on 25 April 1954 (APS) to repaying its carbon debt in 2011 (Louwen et al., Nature Communications, 2016). Methane is the most likely path and the one that will deliver first; peakers and holders follow; renewables is large and depends on one stated assumption; gold is small until a holder survey measures what Bitcoin replaced.
Each section below gives the figure, how it works, what would take it across the line, and what sets the timing. How each figure was built, with sources and the reasoning behind every assumption, is in the appendix.
The energy side
Path 1: Mining on methane that would otherwise be vented or flared
Estimated current emissions mitigated: 4.7 Mt a year, from flare gas (Cambridge, 2nd edition), already deducted in the 35.3 Mt net figure.

Oil wells bring up gas with the oil. Where there is no pipeline to sell it into, the operator burns it off at the wellhead in a flare, and a flare does an imperfect job: 8.9% of the methane passes through unburnt, and methane traps 82.5 times the heat of CO2 over 20 years. A miner puts a generator at the well instead, burns the gas in an engine that destroys almost all of the methane (the UN’s carbon-credit methodology, ACM0001, counts it as 100% destroyed), and uses the electricity on site. The oil company gets paid for gas it was throwing away, and the methane the flare would have let through never reaches the atmosphere.
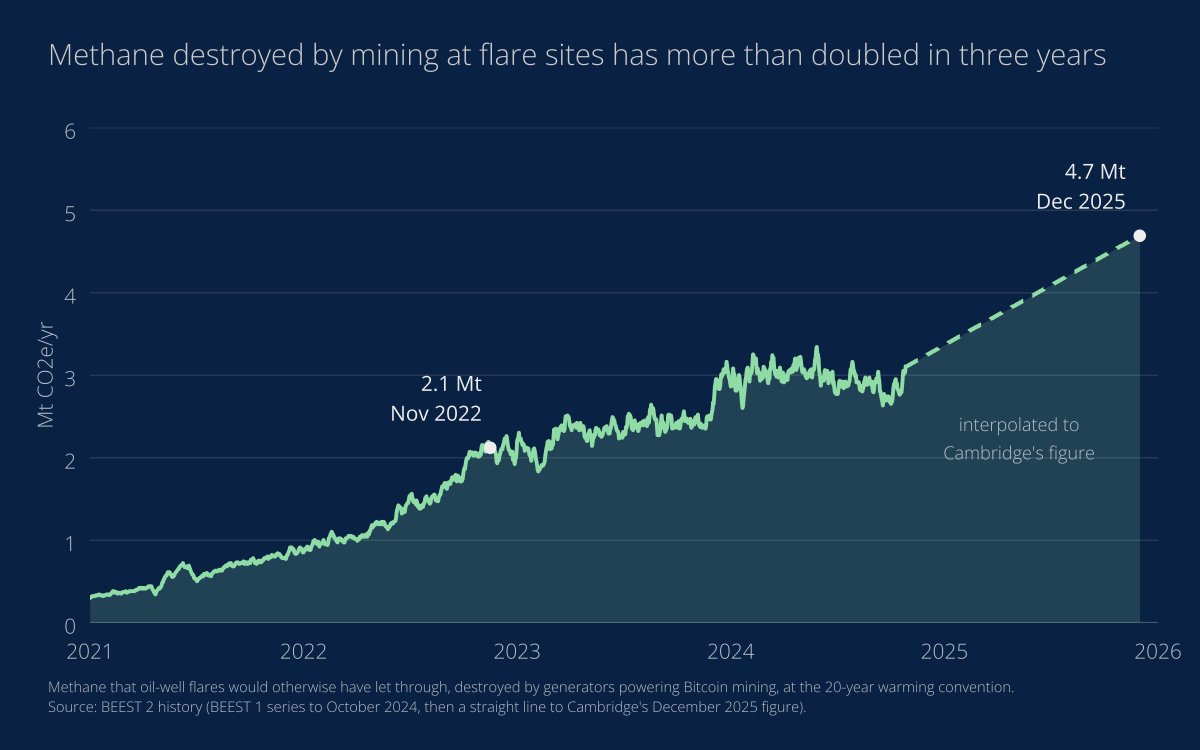
This is the only path already counted. Cambridge counts 4.7 Mt a year of methane destroyed by miners operating at oil wells, on gas that would otherwise be flared at 91.1% efficiency (Plant et al., Science, 2022), valued at the IPCC’s 20-year warming figure (IPCC AR6). That 4.7 Mt is 12% of the way to the line, estimated from a 44-site sample. Cambridge publishes the same destruction on the 100-year convention as 1.6 Mt, and that is the figure the conservative column uses throughout this piece, because it is the convention most readers will test it against. The tracker’s net figure uses the 20-year convention, which is the horizon 67 leading climate scientists and engineers recommended to New York’s legislators in March 2026: methane does most of its warming in its first two decades, and cutting it to zero would reduce warming from methane and CO2 by 40% within 20 years, where the same cut in CO2 would take over a century.
Landfills are where the rest of the methane is. Trash rots into methane, and at most of the world’s dumps that methane goes straight into the air, where it traps 80 times the heat of CO2 over 20 years. Capture it, burn it in an engine, and run miners on the electricity, and the same site destroys methane and earns revenue doing it. Nothing else buys the gas. Nuno Barbosa, CEO of Unicarbo, has developed landfill-gas power and landfill carbon-credit projects across Latin America for twenty years, and he puts it like this: “there is no path to be able to sell that power to the grid of Mexico. Bitcoin mining is your only option.”
What would take it across the line. 35.3 Mt more methane destroyed a year, on top of today’s 4.7, with the other paths at zero; far less with them counted.
What sets the timing. The first landfill sites are being built now. The date depends on how fast capital and permits allow sites to be built. Each site that switches on adds a metered amount to the 4.7 Mt, which is what makes this the one path whose progress can be audited.
Path 2: Gas peaker plants not built, or not run

Estimated current emissions mitigated: ~1.0 Mt a year at the 5.3% of the year that US peakers averaged in 2022; ~3.7 Mt at the 13% that EIA records for the whole simple-cycle gas fleet.
A grid keeps gas turbines on standby for the few hundred hours a year when demand outruns supply: the 1,087 peaker plants in the United States ran 464 hours each in 2022, 5.3% of the year (Clean Energy Group). Texas instead keeps ~4.6 GW of Bitcoin mining that switches off within minutes when the grid operator asks. ERCOT plans around it: its reserve report treats every load as firm except “Large Flexible Loads, i.e., crypto-currency mining”; all 12 of its registered Controllable Load Resources are mines; mines supplied 64% of the emergency reserve capacity it bought for the winter of 2025-26; and in Winter Storm Fern, in January 2026, ERCOT recorded a ~4,100 MW reduction from mining (Potomac Economics, 2025 State of the Market). The long-run model of the Texas market that Bruno, Weber and Yates published in 2023 reaches the same conclusion from a model: with Bitcoin load on the system, the optimal peaker fleet is zero (Resource and Energy Economics).
After the 2021 blackout, Berkshire Hathaway Energy offered Texas $8.3bn of emergency-only gas plants, 10 GW that would run only when demand outstripped supply (Bloomberg, March 2021). Texas did not buy them. 3 GW of that kind of plant, the amount of load the mining fleet has shown it can shed, running 464 hours a year, burns enough gas to emit 0.8 Mt of CO2 directly and leaks enough methane upstream to add another 0.2 Mt at the 20-year figure: 1.0 Mt a year that Texas does not emit because the miners switch off instead. A turbine that is switched off emits nothing, so the figure counts the hours it would run and the methane leaked in producing the gas it would burn; the emissions of starting it up each time are left out.
What would take it across the line. This path adds a fixed amount per gigawatt rather than crossing the line on its own: ~0.35 Mt a year for each gigawatt of flexible mining that substitutes for a peaker, at 5.3% utilization. Any other grid that enrolls flexible mining as a reserve would add ~0.35 Mt a year for each gigawatt.
What sets the timing. It is already happening on the one grid that has measured it. The figure grows with the mining fleet enrolled as a grid resource, which in ERCOT went from 9 resources in late 2023 to 75 in the winter of 2025-26.
Path 3: Wind and solar brought forward by mining’s demand

Estimated current emissions effect: ~0.4 Mt a year measured; in Texas, where the mechanism has run at scale since 2021, an estimated ~5.5 Mt a year that the standard accounting charges to Bitcoin and that the state’s grid does not emit (see the appendix for the rationale and the 20% attribution behind it).
What kills a West Texas wind or solar project is not average price, it is the price in its own best hours. A merchant farm’s revenue collapses as more farms like it come online, because they all generate at once and push the price negative in exactly the hours they produce. Energy economists call this cannibalization, and it is why Ireland’s curtailment went from 4-5% to 11.4% as wind grew. A buyer who turns up in those hours and stops the price going negative is worth more to the project than the same number of megawatt-hours spread across the day. Mining is that buyer: it runs flat out when prices are low and switches off when they are high. Hutabarat (2026) and Sarnecki and Burke (2026) both make the mechanism explicit; Sarnecki measures it at +32% revenue for a 100 MW wind farm with 20 MW of mining beside it.
Texas added 42.1 GW of wind and solar between September 2021 and October 2025, and its curtailment rate did not rise. Mining supplied ~35 to 40% of the state’s demand growth over the same years, and nearly all of the demand that responds to price. Attributing one fifth of those additions to mining, 8.4 GW, is the assumption behind the ~5.5 Mt. The one peer-reviewed model of the Texas system with and without mining puts the share at 27% (see the appendix); one fifth sits below it.
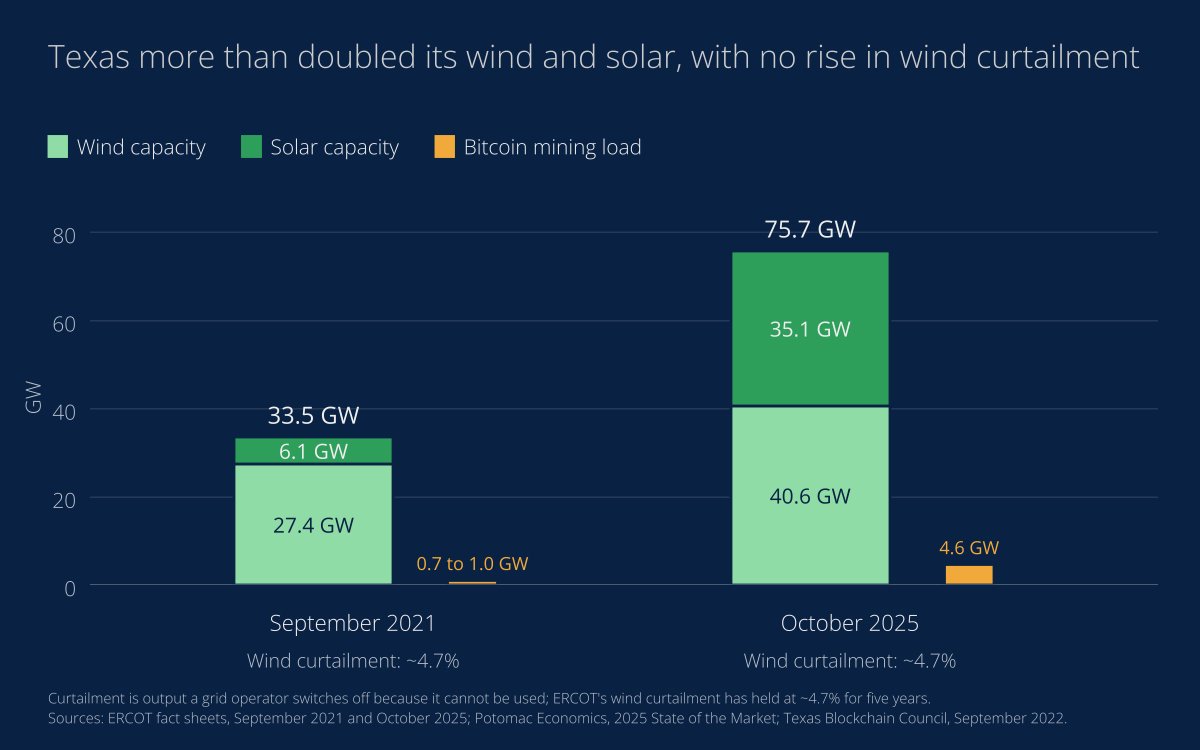
What would take it across the line. This path lowers the line rather than crossing it. The wind and solar that mining brings forward serve mining’s own load first; only above a ratio of three new renewable gigawatts per gigawatt of mining does the surplus reach other consumers. Bruno, Weber and Yates’s equilibrium is 4.9 to 1, and at that ratio Texas’s mining would be displacing ~10 Mt a year of gas generation for other consumers.
What sets the timing. The effect accumulates as capacity follows the price signal, with a lag of 3 to 5 years. Texas is four years into that lag.
The monetary side
Path 4: Digital gold replacing physical gold

Estimated current emissions mitigated: ~1.1 Mt a year on the share of Bitcoin held as savings; ~1.4 Mt on all of it; 5.5 Mt if every dollar in Bitcoin would otherwise be in gold.
Gold mining emits 126 Mt CO2e a year (World Gold Council, 2018 inventory), 36,100 metric tons of CO2e for every metric ton of gold dug up (all tons here are metric), and mines produce what buyers demand. In the West, Bitcoin’s main use today is the one gold had: a store of value. I held gold once; I hold bitcoin instead. When a function moves to a new product, the old product is made in smaller quantities, as cassettes were once MP3s arrived and as gasoline cars are as electric ones sell.
There are two steps: compare the two stocks, then work out where Bitcoin’s money came from. All the gold ever mined, 224,200 tons, is worth $30.0tn (World Gold Council, end of September 2026), and supplying demand for that stock is what the 126 Mt a year of mining does. Bitcoin is worth $1.31tn, one twenty-third as much. If all of that $1.31tn were held in gold instead, gold’s stock, its mining and its emissions would each be 4.4% larger: 5.5 Mt a year, the ceiling for this path at today’s values.
Not all of it would be. Money saved in Bitcoin could have come out of gold, out of shares held for the long term, out of a bank account, or from people who were not saving at all before. The one survey that has asked found that 52% of American Bitcoin buyers sold gold or stocks to buy it (ChainPlay survey, January 2025); it does not split the two, so this piece splits them evenly and counts 26% of Bitcoin’s value as money that would otherwise be gold: 1.4 Mt a year. Three quarters of all bitcoin has not moved in five months (CoinDesk, June 2026), the share held as savings rather than traded, and the conservative figure counts only that: 1.1 Mt. Shares are left out of the count, because selling a share changes who owns the company and not what it emits, where gold is mined because people want to hold it. Gold demand set a record in 2025 with Bitcoin alongside it; the claim here is only that it would have been higher still.
The 2025 flows show the trend. In 2025 investors bought 2,175 tons of gold, $246bn at the year’s average price (World Gold Council, 2025 full year), while $46.6bn went into US spot Bitcoin ETFs (The Block) and Strategy’s purchases (its filings) alone: one new store-of-value dollar into Bitcoin for every 5.3 into gold, against one in 23 by stock. New savers are choosing Bitcoin at four times the rate the existing stocks would predict. Had all of that $46.6bn been gold money it would have bought 412 tons and 14.9 Mt of mining emissions, which is the size of the path at 2025’s pace of inflow.
What would take it across the line. On its own, Bitcoin worth $36.5tn at today’s gold price, ~$1.8m a coin, at the 26% share; this path does not cross the line alone; it takes 1 to 1.4 Mt off what the other paths have to mitigate.
What sets the timing. The date for this path is set by one measurement the piece does not have: a holder survey that asks what Bitcoin replaced, gold, shares, a bank balance or nothing. Until it is asked, the path is counted at the one survey figure that exists, and 5.5 Mt is the most the answer could add.
Path 5: Holder discretionary spend reduction, so less gets made

Estimated current emissions mitigated: ~4.2 Mt a year on a conservative 10% cut to non-essential spending by 20 million savers; ~8.3 Mt on the central 20% cut. Not counted in any emissions ledger today.
Money that loses value every year rewards spending it now; an asset with a fixed supply of 21 million rewards waiting. The behavior appears in every dataset that has measured it. Long-term holders discount the future far less than short-term holders (0.42 against 0.77 on the standard test, El Haj and Moustafa, 2023). Businesses buying through River put an average 22% of net income into the asset, and 63.6% report no plans to sell (River, 2025). Coins that have not moved for 155 days or more are 75% of supply (CoinDesk, June 2026).
How many people behave this way? The only nationally representative survey of US ownership found 48 million adult holders, 11 million of them holding their own keys (Nakamoto Project), and River’s 2025 count puts US holders at ~50 million, more than the 37 million who hold gold (River, via Benzinga). The arithmetic uses 20 million savers worldwide, fewer than half of the US holders alone, as the people who treat Bitcoin as savings rather than a trade; with three quarters of the supply unmoved for five months, saving is the typical behavior, so 20 million is a floor rather than an estimate. A developed-world consumer’s footprint is ~12.5 tCO2e a year, and non-essential goods and services are 22% of it (Starr et al., 2023). A saver who cuts non-essential spending by 20% removes 0.55 t a year; blended with lower-footprint emerging-market savers, 0.415 t. Across 20 million savers that is ~8.3 Mt, 21% of the network’s emissions, from behavior that costs nobody anything.
What would take it across the line. 40.0 ÷ 0.415 = 96 million savers at a 20% cut. The number of holders has grown 8.3% a year (Crypto.com, 2025); if the share who save holds constant, 20 million savers become 96 million in ~2046 at that rate, and in ~2038 if adoption runs at 15% a year. At a 10% cut, double the savers and add 9 years.
What sets the timing. The 2038 to 2046 window is set by one quantity nobody has measured: by how much a Bitcoin saver actually cuts discretionary spending after they start holding. One battery of questions on a representative holder survey, asking whether spending on non-essentials changed after acquisition and by what percentage, split by self-custody and holding period, would turn this from a scenario into an estimate. Until it is asked, the date is a range; once it is asked, it is a year.
The sixth avenue: Lightning payments that replace card payments
I ran this one and it does not make the list. A card payment costs 3.8 g CO2e once the terminals, cards and data centers are counted (De Nederlandsche Bank, 2015 data; cash is 4.6 g). A Lightning payment adds nothing to network emissions, because the channels that carry it are already inside the 40.0 Mt. Lightning carried 5.2 million payments in November 2025 (River, via Cointelegraph), which saves ~240 tons of CO2e a year, 0.0002 Mt. The world made 772.73 billion card payments in 2024 (Nilson Report), so the entire global card system emits 2.9 Mt a year, and Lightning would need to carry every one of those payments, ~12,000 times today’s volume, to mitigate 7% of the network’s emissions. Bitcoin’s payments layer costs the climate nothing per transaction, and the card system it is compared with costs very little either.
Total emission mitigation today
| Path | Conservative | Central | Basis |
|---|---|---|---|
| Methane (flare gas) | 1.6 Mt | 4.7 Mt | Cambridge; 100-year / 20-year warming convention (IPCC AR6) |
| Peakers not built or run | 1.0 Mt | 3.7 Mt | 3 GW in Texas (Potomac) at 5.3% (Clean Energy Group) / 13% (EIA) utilization, plus upstream methane leakage (Sherwin et al.) |
| Wind and solar brought forward | 0.4 Mt | 5.5 Mt | Measured co-located sites (Cambridge; Lal and You) / Texas additions at a 20% attribution (EIA) |
| Digital gold replacing physical gold | 1.1 Mt | 1.4 Mt | Bitcoin’s $1.3tn against gold’s $30tn stock (World Gold Council), 26% taken as gold money (ChainPlay) |
| Holder discretionary spend reduction | 4.2 Mt | 8.3 Mt | 20 million savers (Nakamoto Project), 10% / 20% cut to non-essential spending (Starr et al.) |
| Total, and share of the 40.0 Mt | 8.3 Mt, 21% | 23.6 Mt, 59% |
The chart below sets the two columns against the 40.0 Mt line. The gray remainder is what the network still emits after every path is counted.
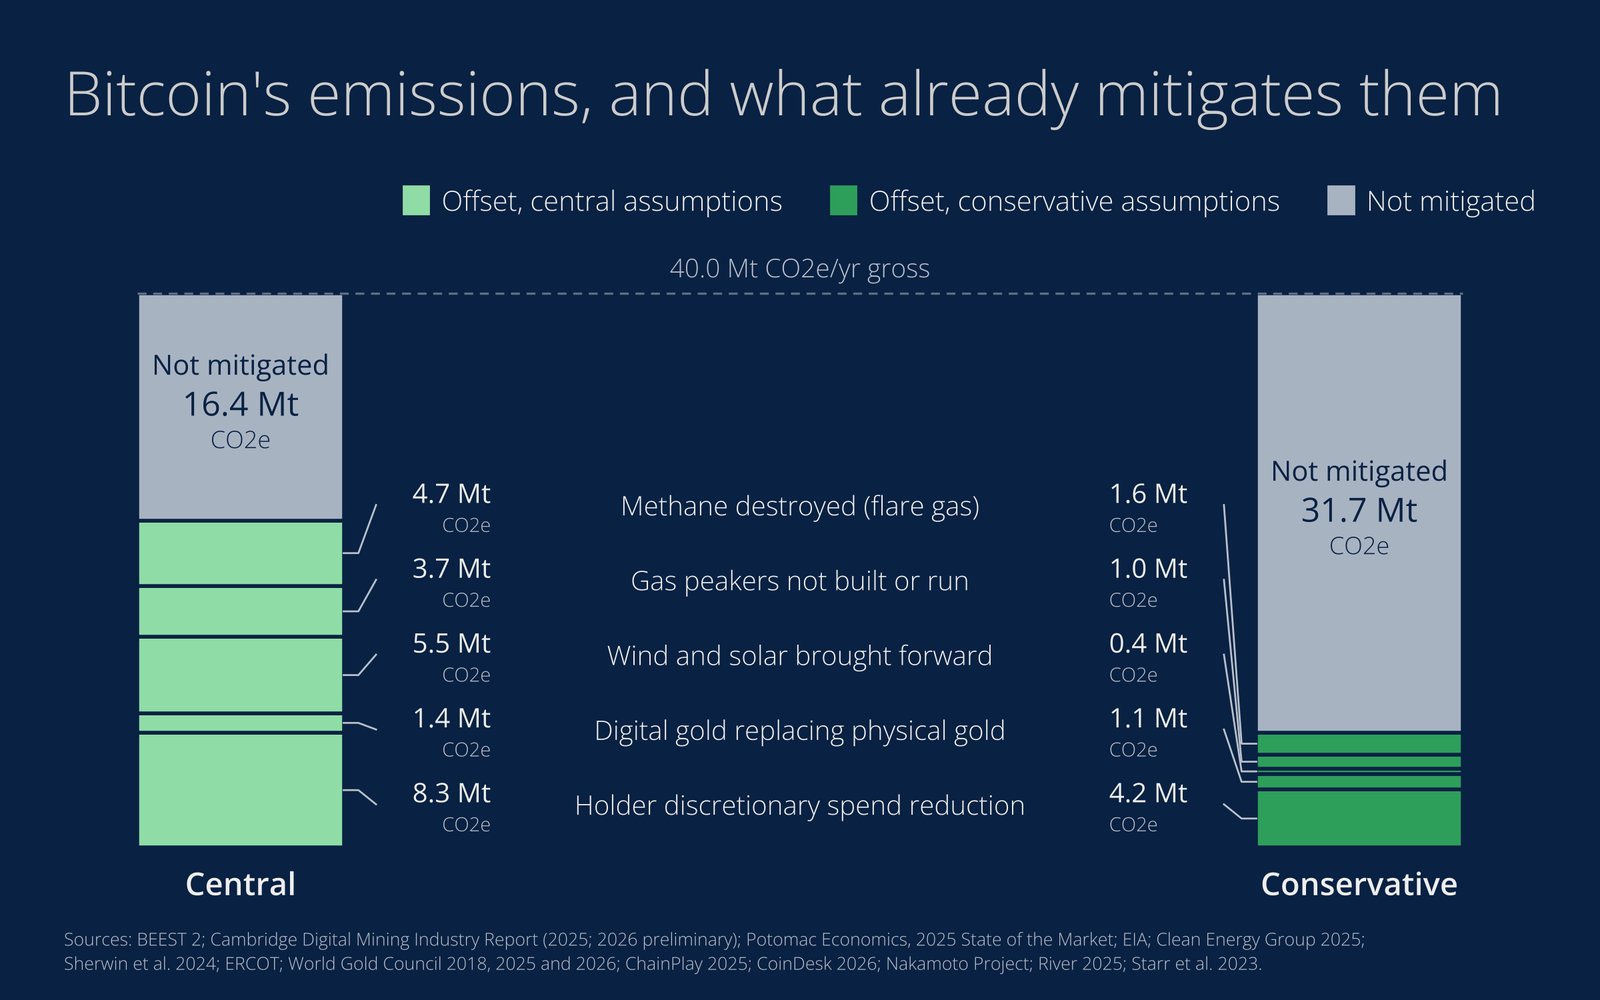
Net of all five paths, the network stands at ~31.7 Mt today on the conservative figures and ~16.4 Mt on the central figures.
Ranking the five paths
Most likely, and first to deliver: methane, path 1. It is the only one already counted, it is metered at the site, the gas has no other buyer, and the remaining distance after the other paths is 16 to 32 Mt a year. Its date depends on how fast capital is deployed.
Second: peakers, path 2. Measured on one grid, written into that grid’s own planning rules, and growing with every mine that registers as a grid resource. It is small per gigawatt and certain per gigawatt.
Third: holder behavior, path 5. As large as methane today on a conservative cut and twice it on the central one, with one unmeasured input, the size of the spending cut. On its own it crosses the line late, 2038 to 2046; its value in the meantime is what it takes off what the other paths have to mitigate.
Fourth: gold, path 4. Built from two measured stocks, gold’s $30tn and Bitcoin’s $1.3tn, and one survey of where Bitcoin’s money came from, split down the middle where the survey did not split it. The smallest of the five paths on the central case, and the one a holder survey would move most, in either direction.
Fifth: renewables brought forward, path 3. Potentially the largest of the five paths in Texas, with the mechanism settled in the literature and the attribution set below the one modeled estimate; it is best accounted for as a lower line rather than a deduction below it.
The path to carbon negative
On current trends, the network’s mitigation overtakes its emissions in 2031 on the central case and in 2047 on the conservative case. The two dates depend on different inputs. The central date moves little if flare-gas growth is halved (2033) or stopped altogether (2037), because landfills, renewables and holders account for most of it. The conservative date depends almost entirely on flare-gas mitigation continuing to compound at 15% a year for twenty years; hold methane flat and the conservative case does not cross this century.
The chart below shows the seven years of recorded emissions first, then runs the two cases forward from today. The solid red line is the tracker’s record from 2019; the dashed red line holds it at today’s 40.0 Mt; the green lines are total mitigation on the central and conservative rules, and the dots mark the year each overtakes it.
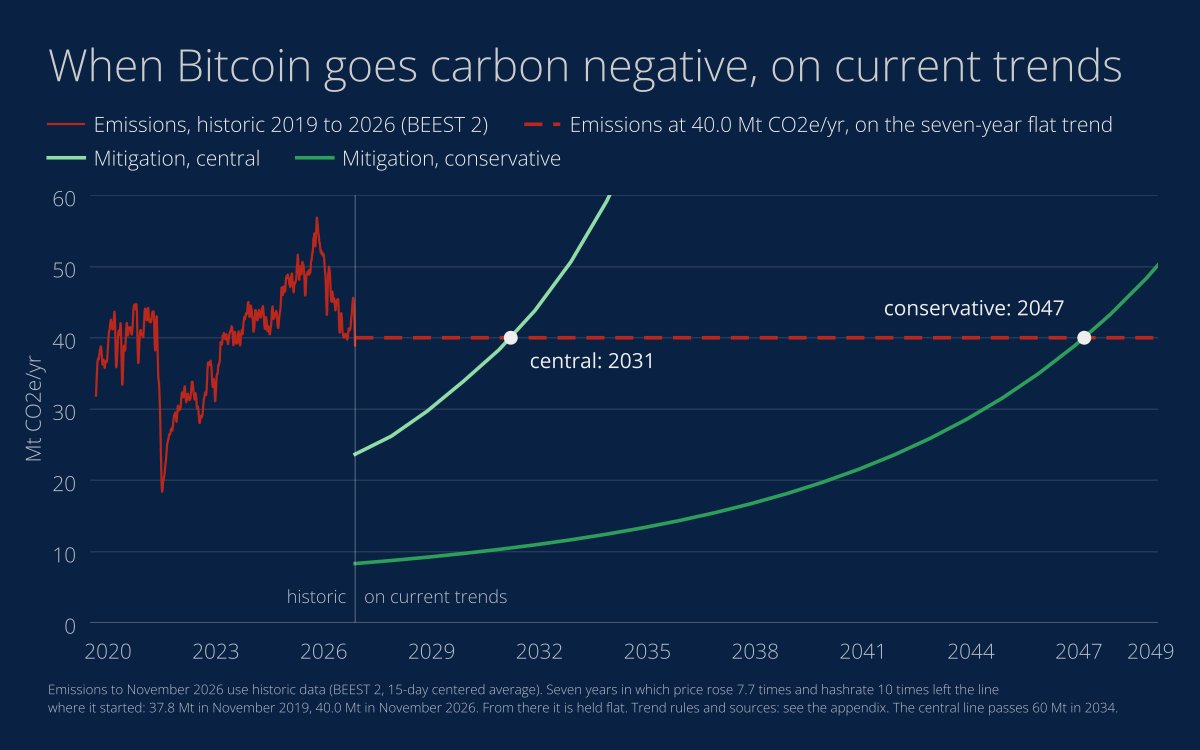
Emissions remain flat because that is what the tracker’s seven-year record shows: 37.8 Mt on 16 November 2019 and 40.0 Mt on 16 November 2026, while hashrate rose tenfold and price 7.7-fold. Within those years emissions fell to 18 Mt after China’s mining ban in 2021 and rose to 57 Mt at the hashrate peak of late 2025, and returned to the same level each time, due to a more efficient fleet and a cleaner energy mix counteracting rising hashrate.
I’ve extrapolated each of the five paths based on the current trendline, where it exists. Flare-gas mitigation has the longest record: the tracker’s series grew from 2.1 Mt in November 2022 to 4.6 Mt in November 2025, 30% a year. The central case continues that. The conservative case is based on this rate halving. Wind and solar’s share of mining electricity rose from 11.4% in January 2022 to 13.5% in December 2025 in Cambridge’s surveys, 4.4% a year, and both the renewables path and the peaker path grow at that rate in the central case, because they are the same flexible load on the same grids. Holder numbers have grown 8.3% a year. The central case adds one new landfill site in 2028 and two from 2029, 0.5 and then 1.0 Mt a year. Gold is held flat in both cases, and the conservative case holds peakers flat too. The full rules and their sources are in the appendix.
For context, it’s worth contrasting this with the solar industry’s history. Bell Labs demonstrated the modern silicon solar cell on 25 April 1954 (APS). For decades after that, making panels emitted more than the panels avoided, and the only full accounting of the industry puts the year its cumulative avoided emissions overtook its cumulative emissions at 2011 on realistic assumptions, 2001 at best and 2018 at worst (Louwen et al., Nature Communications, 2016): 57 years from invention to carbon debt repaid. Bitcoin’s network went live in January 2009. On the dates above its annual mitigation overtakes its annual emissions between 2031 and 2047, 22 to 38 years from launch; paying back the emissions accumulated before that year then depends on how fast the mitigation lines keep rising.
Bitcoin has five paths to carbon negative, and no other industry I know of has more than one. None of the five is certain on its own, and none needs to be: on the figures above, some combination of them is likely to take the network past that point within the next two decades.
Appendix: how each figure was built
Emissions chart
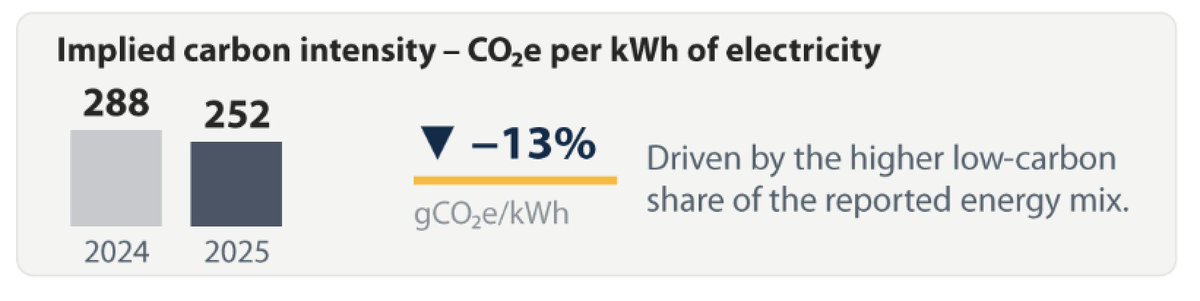
BEEST 2 computes the network’s emissions daily using Cambridge’s 2026 emission intensity numbers, hashrate (mempool.space, 7-day average) × fleet efficiency (19.3 J/TH at the facility, from Cambridge’s and Luxor’s fleet surveys) × 8.76 = TWh a year; × 252 gCO2e/kWh (Cambridge, December 2025 survey mix) = gross; less 4.7 Mt of flare-gas mitigation (Cambridge’s method, restated at the IPCC AR6 20-year warming potential of 82.5) = net. On 16 November 2026: 940 EH/s, 18.1 GW, 159 TWh, 40.0 Mt gross, 35.3 Mt net. Full method at batcoinz.com/beest/methodology.
Path 1: methane
The 4.7 Mt is Cambridge’s flare-gas figure: 507 MW of mining on flared gas across 44 sites, flare efficiency 91.1% (Plant et al., 2022), engine destruction 100% (ACM0001), at AR6’s 20-year warming potential of 82.5.
Landfill methane, being biogenic, is valued at AR6’s non-fossil 20-year potential of 80.
Path 2: obviating gas peaker plants
Capacity: 3 GW, below the ~4.1 GW ERCOT measured mining shedding in Winter Storm Fern and the 4.6 GW of mining on the system in 2025 (Potomac). Plant type: the emergency-only gas plants Berkshire Hathaway Energy offered Texas in 2021 (Bloomberg). Utilization: 5.3% (464 hours), the 2022 average of 1,087 US peakers (Clean Energy Group); 13% central, the US simple-cycle average (EIA); ERCOT’s own simple-cycle fleet ran at 27% in 2022. Emissions: 0.58 tCO2 per MWh, from an 11,000 Btu/kWh heat rate (EIA) and 53.06 kg CO2 per MMBtu (EPA). Upstream methane: 1% of gas produced (national inventory) conservative; 2.95% central, from aerial measurement (Sherwin et al., 2024); at 82.5 times CO2 over 20 years.
3 GW × 464 h = 1.39 TWh; × 0.58 = 0.81 Mt direct; 1.39 TWh at 11,000 Btu/kWh is 15.3 million MMBtu, ~0.29 Mt of methane burned; 1% leaked upstream is 2,900 t, × 82.5 = 0.24 Mt, 1.0 Mt in total. At 13% utilization and 2.95% leakage: 1.98 Mt direct plus 1.76 Mt upstream, 3.7 Mt. At 27% and 2.95%: 7.8 Mt. Start-up emissions and standby fuel are left out of all three.
ERCOT’s treatment of mining as its only non-firm load is in its Capacity, Demand and Reserves report (May 2025); the Controllable Load Resource, Emergency Response Service and Winter Storm Fern figures are from Potomac’s 2025 report and ERCOT operations updates, Jan and Feb 2026. Bruno, Weber and Yates (2023, Table 1): peaker capacity 5.62 GW without Bitcoin, 0 with it.
Path 3: renewable development brought forward
The mechanism. What kills a West Texas wind or solar project is not average price, it is the price in its own best hours. A merchant farm’s revenue collapses as more farms like it come online, because they all generate at once and push the price negative in exactly the hours they produce. Energy economists call this cannibalization, and it is why Ireland’s curtailment went from 4-5% to 11.4% as wind grew (Sarnecki and Burke, 2026). A buyer who turns up in those hours and stops the price going negative is worth more to the project than the same number of megawatt-hours spread across the day. Mining is that buyer: it runs flat out when prices are low and switches off when they are high. Hutabarat (2026) finds a miner beside a wind farm survives a Bitcoin price 45% lower than one running on gas, and that price-responsive mining “can absorb excess renewables at low/negative prices, reducing curtailment”; Sarnecki and Burke measure 20 MW of mining at a 100 MW Irish wind farm absorbing 83.1% of the farm’s curtailed output and lifting its revenue 32%. Lal and You (PNAS, 2024) find the optimal renewable build 25.5% larger for solar and 73.2% larger for wind when mining is in the system.
The observable test is curtailment, and ERCOT passed it while Ireland failed it. ERCOT added 42.1 GW of wind and solar in four years (wind 27.4 → 40.6 GW, solar 6.1 → 35.1 GW, ERCOT fact sheets of September 2021 and October 2025) and its wind curtailment stayed at ~4.7%, “consistent with the last five years” (Potomac 2025), with solar at ~6%. California, with the same policy tailwinds and panel prices and a battery fleet as large as Texas’s, saw curtailment rise from 1.5 TWh in 2021 to 2.4 TWh in 2022 and ~3.4 TWh in 2024 (EIA; PV Tech). Something absorbed a Texas surplus that grew faster than the wires did. Three candidates: new transmission (slow, and the West zone is still the most congested), batteries (0.5 → 17 GW, the strongest rival explanation), and flexible load (700 to 1,000 MW → 4.6 GW of mining). The honest split is by energy absorbed. A battery fleet of 17 GW at ~1.83 hours’ duration holds 31 GWh, which at one full cycle a day is at most ~11 TWh a year; the mining fleet consumes ~36 TWh a year, the bulk of it in the low-price hours. By energy, mining absorbs at least three times what the batteries can, and it was there two years earlier (2021-22 against the battery build of 2024-25).
The 20% attribution. ERCOT’s demand rose 23% between 2021 and 2025 (EIA, October 2025), ~10 GW of average load. Mining went from 700 to 1,000 MW energized in 2021 (Texas Blockchain Council, September 2022) to 4.6 GW in 2025, ~35 to 40% of that growth, and it is nearly all of the demand that responds to price: every one of ERCOT’s Controllable Load Resources is a mine, and mines are 64% of its Emergency Response Service. New generation is built against expected demand and expected price, and mining supplied both the demand and the price floor in the hours that decide a wind or solar project’s revenue. Solar’s build also had the Inflation Reduction Act and falling panel costs behind it, which lifted every project’s returns by the same amount without changing which hours a project earns in. Halving mining’s share of demand growth for those drivers gives 20%, 8.4 GW of the 42.1 GW. The one peer-reviewed model of the Texas system with and without mining gives a higher share: Lal and You find the optimal build 25.5% larger for solar and 73.2% larger for wind when mining is present, which applied to ERCOT’s actual additions (29.0 GW of solar, 13.2 GW of wind) attributes 5.9 GW of solar and 5.6 GW of wind to mining, 11.5 GW, 27% of the total. The 20% used here is below that. The range runs from zero to the Bruno, Weber and Yates equilibrium of 4.9 GW of wind and solar per gigawatt of flexible mining (their Table 1), which for Texas would be 22.5 GW. Developers behave as the mechanism predicts: Soluna’s 120 MW beside a 200 MW South Texas wind farm, and Sangha’s 19.9 MW at a solar site chosen for its “grid congestion and negative energy pricing”.
What the attributed capacity does. 8.4 GW of wind and solar generates ~22 TWh a year. ERCOT’s miners consume ~36 TWh. So the capacity mining brought forward serves mining’s own load, and its emissions effect is that Bitcoin’s Texas consumption is cleaner than grid-average accounting says: 22 TWh served by wind and solar rather than the 252 gCO2e/kWh the tracker charges is ~5.5 Mt a year, and against a gas-served figure ~9 Mt. That is why the body treats this path as lowering the line rather than as a deduction below it, and why it is not added to the tracker’s falling intensity, which captures the same effect as it feeds through. Surplus reaches other consumers only above ~3 GW of new renewables per gigawatt of mining; at the Bruno equilibrium of 4.9, Texas’s 4.6 GW of mining would account for 22.5 GW and ~59 TWh of new renewable generation, 23 TWh of it serving others, ~10 Mt a year of displaced gas at 0.42 t/MWh.
The measured floor. Cambridge’s April 2025 survey finds 8.1% of mining power, 1.23 GW, off-grid, of which 507 MW is flare gas; the remaining 0.72 GW runs directly on co-located generation, mostly renewable. At a 30% capacity factor that is ~2.4 GW of nameplate that exists because a miner is there to buy from it; the Lal and You expansion ratios give 0.5 to 1.0 GW of it as capacity the mining revenue brought forward, and Sarnecki’s 80% of farm output going to the grid gives 0.4 to 0.9 Mt a year of displaced gas. The conservative figure uses 0.4.
Path 4: digital gold vs gold
Gold mining’s footprint: 126.4 MtCO2e for 2018 (WGC, Table 3), 99.9% of it mine production, on 3,503 t mined: 36,100 t CO2e per ton. Vaulting, transport and security are outside the inventory and add well under 1 Mt (Brink’s whole global operation emits 342,500 t a year).
The stocks: above-ground gold 224,200 t, $30.0tn at end-September 2026 (WGC); Bitcoin 20.11 million coins at $65,189 on 16 November 2026, $1.31tn; ratio 22.9 to 1; Bitcoin’s value is 4.4% of gold’s. Ceiling: 126.4 × 1.31 ÷ 30.0 = 5.5 Mt a year, the mining emissions gold would add if all the value held in Bitcoin were held in gold, at constant emissions per dollar of stock.
The source of Bitcoin’s money: 52% of American Bitcoin buyers report having sold gold or stocks to buy it (ChainPlay survey, January 2025); it does not separate the two and its method is unpublished, so it sets the counted figure and not the ceiling. Split evenly, 26% of Bitcoin’s value is taken as money that would otherwise be gold. Central: 5.5 × 0.26 = 1.4 Mt. Conservative: 75% of supply unmoved for 155 days or more (CoinDesk, June 2026) taken as the share held as savings, 1.4 × 0.75 = 1.1 Mt. Shares held long term, bank balances and new saving are the other sources the survey leaves unmeasured; none of them is counted toward gold. Shares are given no mitigation figure in this piece, because a share sold is a share someone else owns, with the company’s emissions unchanged.
The flows: gold investment demand 2,175 t in 2025 (WGC Gold Demand Trends, full year 2025), $245.8bn at the 2025 average price of $3,515/oz (COMEX monthly closes); US spot ETF inflows $21.8bn (The Block) plus Strategy’s $24.8bn of purchases over 2025 (8-K filings), $46.6bn; ratio 5.3 to 1 by flow against 22.9 to 1 by stock. At full substitution of that flow: $46.6bn ÷ ($3,515 × 32,150.7 oz/t) = 412 t; × 36,100 = 14.9 Mt, the path’s size at 2025’s pace rather than a counted figure.
Line-crossing on this path alone: 40.0 ÷ 126.4 = 31.6% of gold’s stock, $9.5tn, ÷ 0.26 = $36.5tn, $1.81m a coin at today’s gold price on the central basis; ÷ 0.75 on the conservative basis, $48.7tn and $2.42m a coin.
Path 5: holders
Saver population: 48 million US adult holders, 11 million with their own keys (Nakamoto Project, Q3 2024); ~50 million US holders against 37 million gold holders (River, 2025). The arithmetic uses 20 million savers worldwide, fewer than half of the US holders alone, with 75% of supply unmoved for 155 days (CoinDesk) as the evidence that holding is the typical behavior.
Per-saver footprint: 12.5 tCO2e a year (US/EU blend); non-essential goods and services 22% of it (Starr et al., 2023); a 20% cut to that category is 0.55 t for a developed-world saver and 0.415 t blended with emerging-market savers at ~0.27 t. Independent estimates of a 20% cut to non-essential purchases by a Western consumer run 0.5 to 0.8 t.
Why 20% and 10%. River’s business customers redirect an average 22% of net income into bitcoin. The model assumes that only a quarter of that redirected income comes out of consumption, and that the other three quarters come out of saving and investment elsewhere or out of income growth. On that assumption, 5.5 points of income are withdrawn from spending. Non-essential goods and services are 20 to 25% of household consumption, so a withdrawal of that size concentrated there is a cut of 22 to 27% of the category; the central figure is set at 20%, below that range, and the conservative figure halves it to 10%. In whole-budget terms those are cuts of 4.4% and 2.2% of total household spending, by a self-selected minority who have already shown the behavior. The IPCC puts the feasible demand-side reduction at 40 to 70% (AR6 WGIII, Chapter 5), which locates a 10 to 20% cut to one category well inside what behavior-change research treats as attainable, and randomized trials of financial coaching show such changes persist (Theodos et al., 2018). The size of the cut remains the one unmeasured input, and one survey question replaces it.
Crossing: 40.0 ÷ 0.415 = 96 million savers; from 20 million at 8.3% a year, 20 years, ~2046; at 15% a year, 11 years, ~2038; at a 10% cut, 193 million savers, 9 more years at 8.3%.
The sixth avenue: Lightning
5.2 million payments a month (River’s estimate for November 2025, via Cointelegraph) × 12 × 3.8 g (DNB, 2015 debit-card lifecycle) = 237 tons per year. This is small enough that it is left out of the totals. 772.73 billion card payments in 2024 (Nilson) × 3.8 g = 2.94 Mt. 772.73 billion ÷ (5.2 million × 12) = 12,383.
The trend scenario
The projection holds emissions at today’s level and runs each path forward on a stated rate. The rules, one per line:
Emissions are held at 40.0 Mt gross throughout. The tracker reads 37.8 Mt on 16 November 2019 and 40.0 Mt on 16 November 2026 (BEEST 2), no meaningful difference over seven years. Emission intensity fell from 600 to 252 gCO2e/kWh over that period, while electricity use rose from 63 to 159 TWh over the same seven years, canceling each other’s emissions impact out.
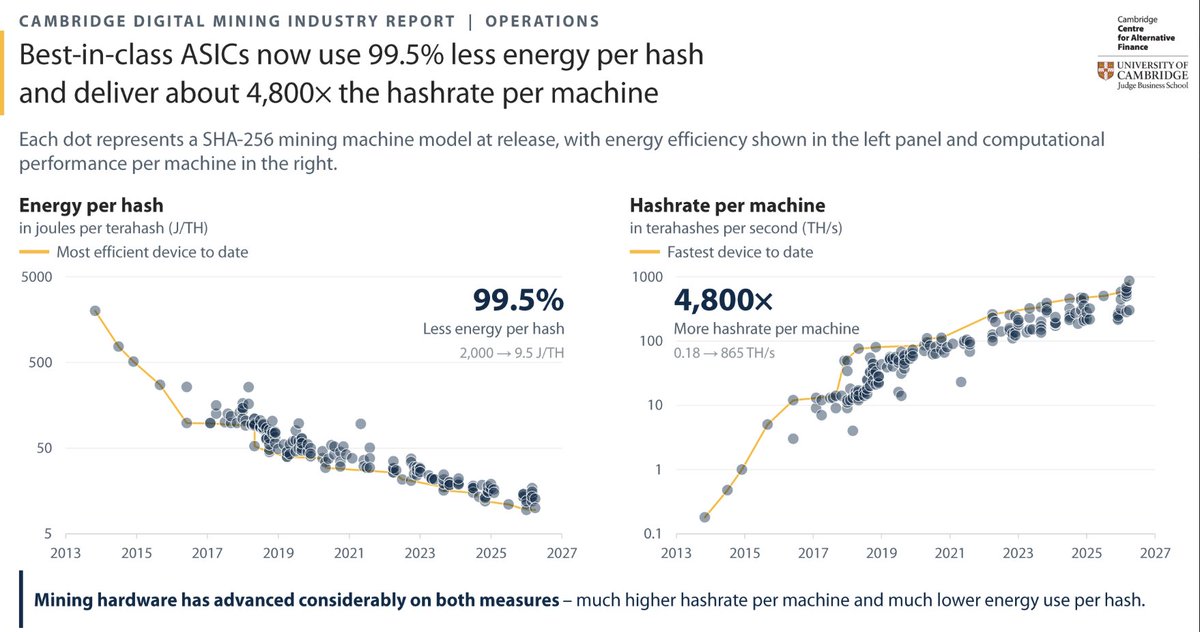
As we can see in the image above (on a log scale), while hashrate has risen exponentially, so has machine efficiency over the same period.
- Flare-gas methane grows 30% a year in the central case, from 4.7 Mt. The rate is a log-linear fit to the tracker’s November readings for 2022 to 2025 (2.12, 2.37, 3.18, 4.63 Mt), which lie on a 30.2% a year line. The 2021 reading (0.83 Mt) is excluded because the base was too small for a rate to mean anything. The conservative case grows at half that, 15% a year, from the 100-year figure of 1.6 Mt.
- Landfill methane enters the central case only: 0.5 Mt in 2028 (one site) and 1.0 Mt a year from 2029 (two sites). This is an assumption about deployment, stated rather than measured.
- Wind and solar brought forward grows 4.4% a year in the central case from 5.5 Mt, and 2.2% a year in the conservative case from 0.4 Mt. The rate is the growth in wind and solar’s share of mining electricity in Cambridge’s surveys, 11.4% in January 2022 (Cambridge, 2022) to 13.5% in December 2025 (Cambridge, 2nd edition). The June 2024 survey read 19.1% (Cambridge, 2025) on a different respondent mix, so the endpoint rate is used.
- Peakers grow 4.4% a year in the central case from 3.7 Mt, the same rate as wind and solar, on the argument that peaker obviation and renewables acceleration are the same flexible load on the same grids. No measured series exists for this line, and it is the least-founded rate in the projection. The conservative case holds peakers flat at 1.0 Mt.
- Gold is held flat in both cases, 1.4 and 1.1 Mt.
- Holders grow 8.3% a year in the central case from 8.3 Mt, the growth in digital-asset owner numbers (Crypto.com, 2025), the only published series, used as the proxy for Bitcoin holders, and 4.15% a year in the conservative case from 4.2 Mt.
The network is carbon negative in the first year in which total mitigation exceeds 40.0 Mt. Central: 2031, at 43.8 Mt (17.6 methane, 1.0 landfill, 4.6 peakers, 6.8 renewables, 1.4 gold, 12.4 holders); 2030 falls short at 38.3 Mt. Conservative: 2047, at 43.2 Mt (30.7 methane, 1.0 peakers, 0.6 renewables, 1.1 gold, 9.9 holders); in 2035 the conservative case stands at 14.3 Mt.
Sensitivities: central with methane at 15% a year crosses in 2033, with methane flat in 2037; conservative with holders at the full 8.3% a year crosses in 2044, with methane flat not this century.
Pingback: Bitcoin: let’s start from scratch – Batcoinz
Pingback: 10 images that forever changed our perceptions about Bitcoin and energy - Batcoinz
Pingback: The Bitcoin facts that every investment committee must know - Batcoinz
Pingback: Accurately, dynamically calculating Bitcoin network emissions - Batcoinz
Pingback: 35 landfills mining Bitcoin = a net-zero emission Bitcoin network - Batcoinz
Pingback: Submission to ESMA on Bitcoin mining - Batcoinz
Pingback: Rebuttal of Greenpeace USA report on Bitcoin - Batcoinz
Pingback: Improving our estimate of Bitcoin energy consumption - Batcoinz
Pingback: Quantifying the emission-negative component of the Bitcoin network - Batcoinz
Pingback: Common false claims about Bitcoin and energy - Batcoinz