Acknowledgements: Mason Jappa – Blockware, the team at Luxor and Fred Thiel – Marathon for making their data, models and methodologies available
Executive Summary
For several years the Cambridge Centre for Alternative Finance (CCAF) has been the most quoted source for Bitcoin energy and power consumption estimates. However, our analysis of CCAF’s Bitcoin power and energy consumption) model (CBECI) shows two issues which result in an over-estimation of energy and power consumption.
- CBECI uses a Bitcoin-price driven miner-mix calculation methodology which not longer reflects current miner behavior.
- The data-set used by CBECI does not reflect efficiency gains in the current generation of machines actively mining on the network.
Due to rapid rises in hashrate in 2023, these factors make a material difference to energy consumption calculations.
We evaluated the data and methodologies from 4 different sources
- 2 Bitcoin mining ASICS market-makers (Blockware and Luxor)
- 1 independent researcher (Khazzaka)
- 1 publicly traded Bitcoin mining company (Marathon)
These methodologies estimate Bitcoin’s energy consumption at significantly less than CBECI. The closest estimate was 23.7% under, and the largest was 37.1% less than the CBEBI model suggested.
We found that both Blockware, Luxor and Marathon approaches to be based on the more up-to-date data, and a more industry-aware understanding of current mining practices relative to CCAF. We haven’t been granted permission to see the methodologies of Khazzaka, so cannot comment on his model at this time.
As a result of
- multiple reading being consistently lower than CBECI
- using methodologies for determining miner-mix which better reflect current mining economics and behaviors
- a more up-to-date data-set for miner-mix,
there is strong reason to believe that the Bitcoin network’s true energy consumption is at least 23.7% less than CBECI suggests.
Why Energy Consumption Calculations matters:
If Energy consumption calculations are overestimated, then so will Bitcoin network emissions calculations. For the BEEST model, we took the more conservative of Luxor and Blockware’s estimates (Blockware), who’s figures imply CCAF are consistently overestimating Bitcoin network consumption by 23.7%.
Background
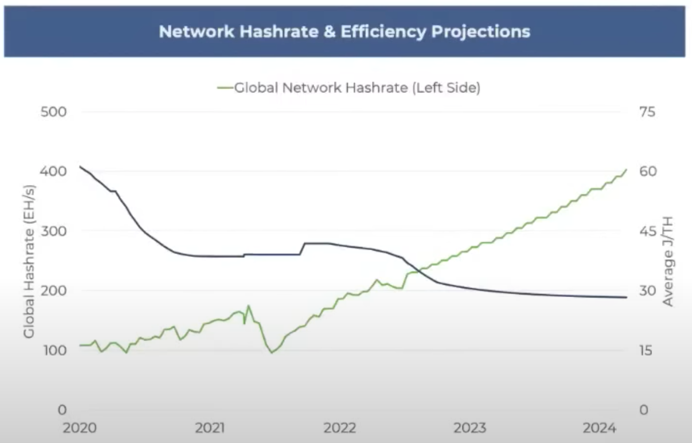
Estimated average ASICS efficiency = (estimated consumption/PUE)/hashrate
For CCAF as of 7 June 2023 this is (15470/1.1)/373.1 = 37.69 J/TH
(The lower the number, the more efficient the network)
When I first saw this chart from the Bitcoin Mining Council’s 2022 presentation, I realised that Marathon’s figures were inconsistent with CCAF.
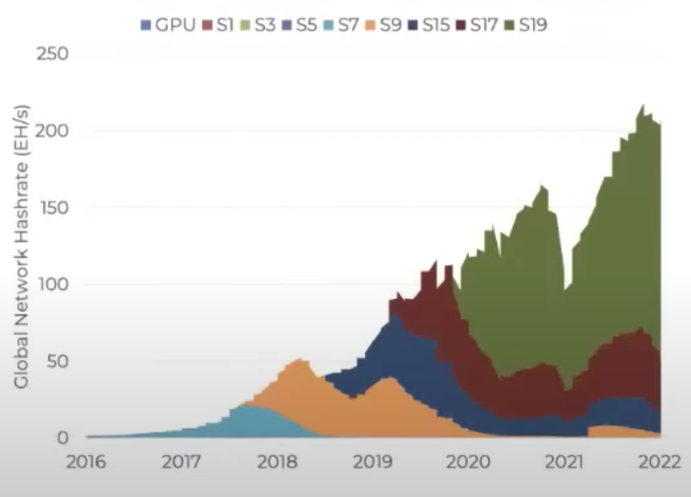
The green area of the graph are S19s, with an average efficiency of 29.5-30.5 J/TH efficiency.
Since, then I knew that a significant portion of new hashrate was coming form players such as Marathon buying S19XP’s which have an average efficiency of 21.5 J/TH.
Some quick back-of-envelope calculations had me suspect that the CCAF interpolated J/TH estimate of 37.69 J/TH was overly high, indicating their total network power consumptions were also overly high.
In short: one of them was wrong. Curious, I started digging into how CCAF calculated it’s energy and power estimates.
Looking at CCAF’s stated methodology I was surprised to see that the Cambridge model assumed that as Bitcoin price spiked, this would cause older, less-efficient ASICS to come onto the network, lowering network energy efficiency.
While that does occur to some extent no doubt, my discussions with various mining companies as well as mining rig suppliers revealed that this is no longer the primary driver for whether older miners come onto the network.
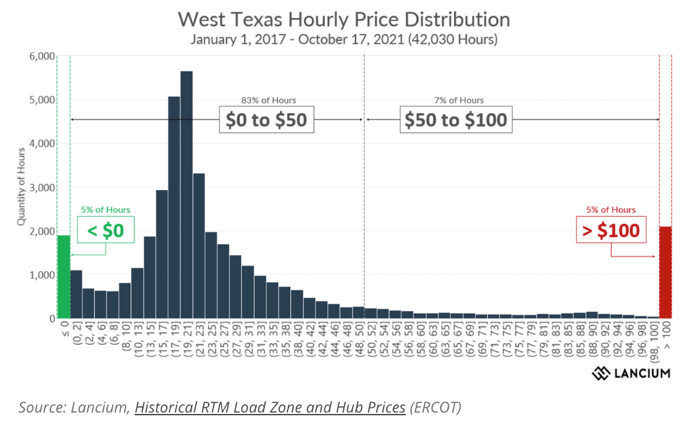
The primary driver is now wholesale electricity price, for the very simple reason that a large portion of the world’s mining rigs are now on grids such as ERCOT which have wild swings in wholesale price. As we can see in the graph below, ERCOT wholesale electricity prices spend ~5% of the time negatively priced, and another ~5% of the time priced above $100/MW.
In short, if you think Bitcoin price swings are volatile, that is nothing compared to the wild world of wholesale electricity prices, which are of course Bitcoin miners single biggest OPEX expense.
So in summary, the CCAF model assumptions seemed to have grown outdated.
Checking on their data set I observed that that was also becoming increasingly outdated (miner map last updated Jan 2022, sustainable energy mix last calculated Oct 2022). In a fast-changing industry, these timeframes mattered in a material way.
So, I decided to check actual industry players, such as ASICS market-maker Blockware and ASICS marketplace vendor Luxor. I triangulated their estimates with an independent source: Michel Khazzaka.
It turned out that each of them had more up-to-the-minute data and concurred that wholesale price of electricity was the major driver for whether older Bitcoin mining rigs came onto the network: when prices went low or negative – they entered the network.
This was happening throughout the year in a relatively distributed way, meaning that a simpler model that calculated miner mix based on different electricity price thresholds was going to be more accurate than Cambridge’s more complex model that attempts to calculate the impact of Bitcoin’s price rise (ie: attending to the secondary driver, but ignoring the primary driver of miner mix).
Analysis of different energy and power estimates
1. Khazzaka
Implied CCAF overestimate: 37.1%
Michel Khazzaka, who founded payments consultancy Valuechain in late 2021, proposes an alternative to the energy estimates provided by Cambridge Bitcoin Electricity Consumption Index (CBECI). At the time of Khazzaka’s estimate, CBECI index estimated that Bitcoin consumes roughly 122 TWh per year.
Taking into account the average lifespan of Bitcoin mining machines as well as the rate at which new IT materials are created, Khazzaka suggests that Bitcoin consumes 88.95 TWh per year, considerably less than Cambridge’s estimate.
Based on his estimates, CCAF’s overestimation of Bitcoin energy consmption = (122-88.95)/88.95 = 37.16%
2. Blockware
Implied CCAF overestimate: 23.7%
Blockware have up-to-minute information on miner mix, stored in a database format. They run analytics over the top regularly.
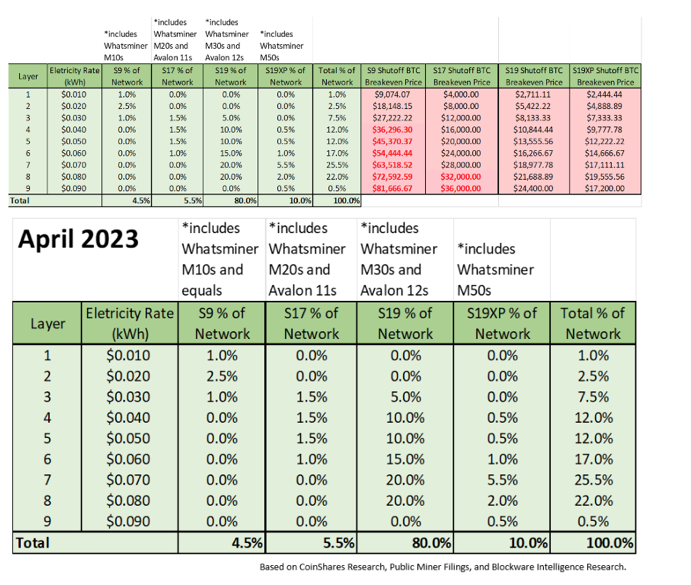
Their methodology estimates that as of April 2023, the Bitcoin network had an efficiency of 32.2 J/TH. This implies a CCAF overestimate of 23.7%
Data summary below:
Base: 200 EH/s April 2022
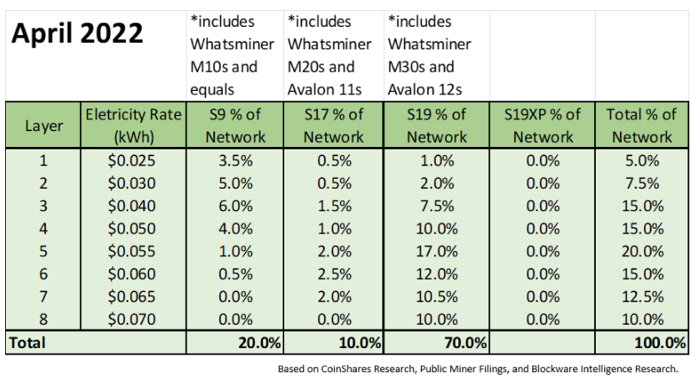
- S9 = 40 EH/s
- S17 = 20 EH/s
- S19 = 140 EH/s
Based on previous a Blockware Intelligence Report using public miner investor relations resources, Coinshare’s Research, and Blockware Research.
Estimate: 340 EH/s April 2023 (Estimated Weighted Average Efficiency = 32.2 J/TH)
Assumptions/Estimations:
- 82.5% of S9s (33 EH/s) wiped out (layers 2-8 in table above)
- 25% of those S9s (8.25 EH/s) sold and relocated to lower electricity layers
- No new S9s were manufactured
- Remaining S9s hashing: 15.25 EH/s
- 20% of S17s (4 EH/s) wiped out (layers 8-9 in chart below)
- 75% of those S17s (3 EH/s) sold and relocated to lower electricity layers
- No new S17s were manufactured
- Remaining S17s hashing: 19 EH/s
- No S19s wiped out
- More S19s were manufactured
- S19XPs were manufactured and deployed
3. Luxor
Implied CCAF overestimate: 33.4%
Luxor generate their own Bitcoin power consumption chart called BMECI. It is a simple yet effective chart, based on up-to-date mining mix data and correct assumptions about how older miners enter the network (driven by wholesale electricity price). My only significant omission is that it does not include PUE (Power Use Effectiveness), which CCAF correctly include and estimate to cause a 10% premium on power consumption. As a result, Luxor slightly underestimates true Bitcoin mining energy consumption.
Taking Luxor’s base data and adding in PUE we get the following comparison between Luxor’s BMECI model and CCAF’s CBECI model estimate:
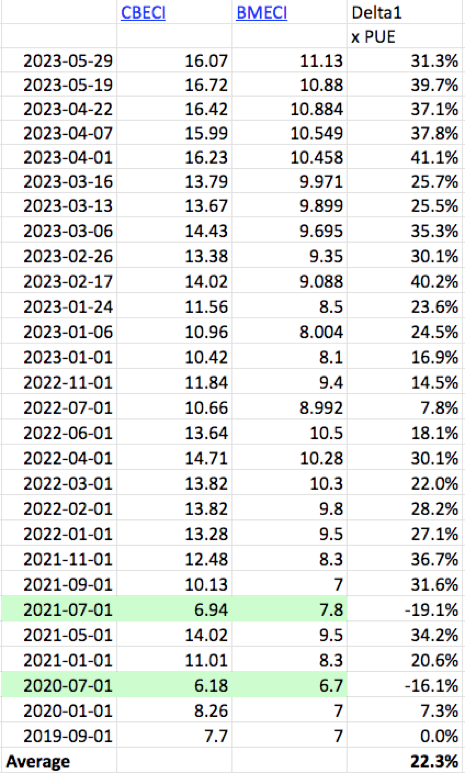
As we can see, from 2019-mid 2021 the charts were in close agreement. CCAF even came in with more conservative readings than Luxor on two occasions (highlighted green). However, after July 2021 the two models diverged meaningfully.
The overall difference in estimates is 22.3% across the whole period, but from Jan 24 2023 until today, there is a more significant 33.4% difference in estimates.
4. Marathon Digital Holdings
Implied CCAF overestimate: 29.7
Based on Marathon’s 30 J/TH estimate of overall network efficiency, Marathon’s figures are 29.7% lower than CCAF’s.
Source BTC Q2 Report 2022, Marathon Digital Holdings: