
Executive Summary
We find that the most oft-cited emissions calculation (CCAF’s estimated emissions) for the Bitcoin network overestimates true emissions by > 100%. The emissions numbers is skewed strongly to the upside because each of the factors that multiply together to produce this number are themselves overestimated
| Data as of 9 June 2023 | CCAF calculation | BEEST calculation | Current CCAF variance |
| Emission Intensity | 506.7 g/kWh | 299 g/kWh | +69.4% |
| Energy Consumption/yr | 138.6 TWh | 115.0 TWh | +20.6% |
| Emissions | 70.22 Mt CO2e | 34.07 Mt CO2e | +106.1% |
Background
The reasons we conclude CCAF has overestimated energy consumption are covered in our earlier paper. This article covers how we reached the view that emission intensity, and therefore total emissions, calculations are even more significantly overstated.
First, an acknowledgement: Bitcoin, like Electric Vehicles, has no direct (scope 1) emissions. Like Electric Vehicles however, both do have scope-2 emissions, because both use electricity which will in some cases have been generated using fossil fuel sources.
Bitcoin emissions are calculated by working out by (multiplying emission intensity) x (energy consumption of the network).
Just like you can calculate GDP by multiplying (GDP per capita)x(population of that country).
Just like in economic, GDP per capita is a common measure of a nation’s economic position, Emission intensity is a common tool that the environmental/energy sectors use to evaluate an industry’s environmental impact.
Just as an economist would like to look at both GDP and GDP-per-capita before making a pronouncement on a nation’s prosperity, its a good idea to look at not only the emissions, but also the emissions per unit-of-energy before making pronouncements on an industry’s environmental impact.
Methodology Overview
Calculating emissions of the Bitcoin network requires many data inputs.
First, you build a ground-up model of emission intensity, factoring in fuel-source of all known mining companies, and using national grid fuel-mix emission intensity where unknown (which tends to slightly overstate fossil fuel mix, as offgrid mining operations tend to use higher renewable levels).
Then you use ASICs (mining rig) data to calculate average J/TH of the network, then multiply by current hashrate to get an energy calculation. Then you take that energy consumption calculation and multiply it by emission intensity to get emissions. Finally you factor in fuel sources such as flaring of previously atmosphere-bound methane emissions that have a small emission mitigating impact.
Analysis
Energy Consumption
In an earlier research paper, we calculated Bitcoin’s energy consumption by comparing 5 different methodologies (including CBECI). There is compelling reason to believe the Bitcoin network consistently uses at least 23.7% less energy than the most commonly used metric to date (CBECI). Our analysis led us to the conclusion the Blockware have more up-to-date miner-mix and a superior methodology (reflects the real-world ways that miners choose whether to mine with less efficient machines, which is determined primarily by wholesale electricity price, with Bitcoin price being the secondary factor).
Blockware estimate that the current efficiency of the network as of April 2023 was 32.2 J/TH: 31.8 J/TH at the time of writing. Based on a current hashrate of 375.4 and PUE of 10%, this gives us a 31.8×375.4×1.1 = 13,131 MW power usage. Multiplying this by the number of hours in a year (8760), this gives us 115 TWh of energy use per year.
Emission Intensity
Each different energy source has a different emission intensity. This is typically measured in either tonnes of CO2e emissions/MWh, or grams of CO2e emissions/KWh. (MWh and KWh – Megawatt-hour, and Kilowatt-hour are simply different units of energy. A kilowatt hour is the amount of energy you’d have used if you ran 1000 Watts of power (such as leaving 10 of 100Watt lightbulbs on in your home) for one hour.
Depending on the grid you’re plugged into though, this will have different emission intensity. If you live in New Zealand like me with an 80%+ renewable energy grid, this will have a low emission intensity. If you live in Kazakhstan which uses over 90% fossil fuel, it will have a high emission intensity.
Renewable energy sources will have an emission intensity of zero (or very close to zero if you factor in total lifecycle emissions_
Also, not all fossil fuels are created equal. For example, natural gas has less than half the emission intensity of coal. To put it another way, there is a bigger emission intensity difference between coal and gas, than there is between gas and solar.
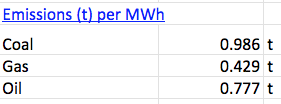
If you’re interested in the wide variation there is in the emission intensity of different grids, you can have a look at my BEEST model raw data, “Emissions per MWh” tab. Here, I’m dynamically calculating on a daily basis the current estimated emission intensity of different electrical grids around the world.
In a previous paper, we acknowledged CCAF (Cambridge Centre for Alternative Finance) for transparently stating some of their model limitations which in recent times have led to significant variation from the likely true state of the Network. Most notably their estimates did not include offgrid mining activity, which our BEEST model showed to be 28% of all miners. Critically, this 28% uses 78% sustainable energy sources, much higher than the network average. Other factors which result in CCAF underestimating Bitcoin’s use of sustainable energy sources include the age of their dataset (miner map was last updated Jan 2022). Bitriver’s later dataset suggests under 1% (100MW) of the Bitcoin network’s hashpower is based on the 88%-fossil fuel based (and 68% coal based) Kazakh grid. This is a far cry from the last CCAF estimate that 13% of the network mined in Kazakhstan (true at the time).
ERCOT and offgrid miners together represent 52% of the network, and have a combined sustainable energy mix of 64.7%. This is the portion of the network that is not represented in CCAF’s data. To their credit, they acknowledge this on their website under “Model Limitations.”

As a result, our emission intensity numbers come in as decreasing rapidly as miners migrated to offgrid sustainable sources, and off the Kazakh grid since after the China-ban. Also, the loss of miner hashpower to China helped reduce emission intensity: even though during the wet season miners used hydro power, the other 7-8 months of the year they used coal. As China’s star faded, the Texas grid (ERCOT) rose, and at the time of writing represents 24% of all mining activity. With it’s high proportion of sustainable energy and gas, the emission intensity of the ERCOT grid is only 0.286 t/MWh. This also had a significant impact on lowering the emission intensity of Bitcoin mining.
Notably, CCAF data largely excluded ERCOT-based mining1. This was another reason for the failure of their model to pick up on the rapid decline in Bitcoin network emission intensity.
Factor in all these variables, we arrive at a current emission intensity of 299g/KWh.
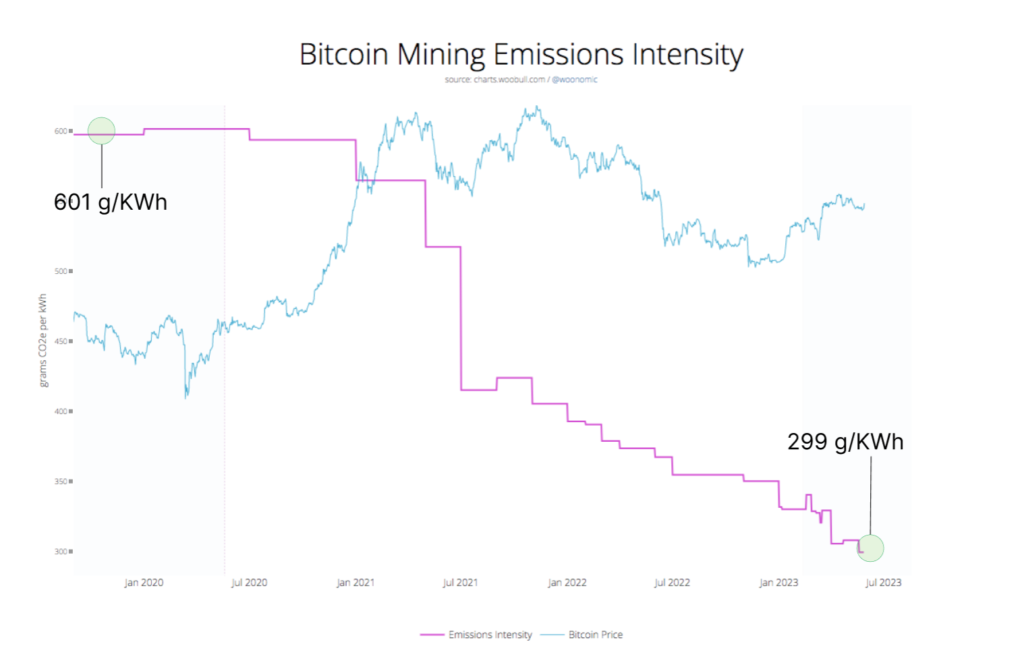
source: batcoinz.com/BEEST
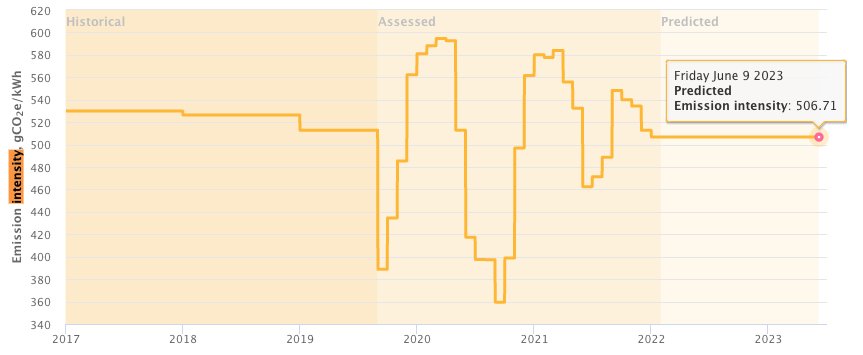
Due to the model-exclusions stated above, CCAF data currently over-estimates Bitcoin emission intensity at 506.7 g/KWh. As we can see, their emission intensity chart has not been updated since Jan 2022, when it was still likely overestimated, but not to the same degree).
We find this figure to be 69% higher than the likely true figure, which will significantly impact any emission estimates.
Emissions
Multiplying energy consumption by emission intensity, we get the following view of total emissions over the last 3.5 years (as far as our data stretches back)
Importantly this shows the Bitcoin network having “matured” to a point where hashrate is growing, but emissions are falling (for the reasons outlined above).
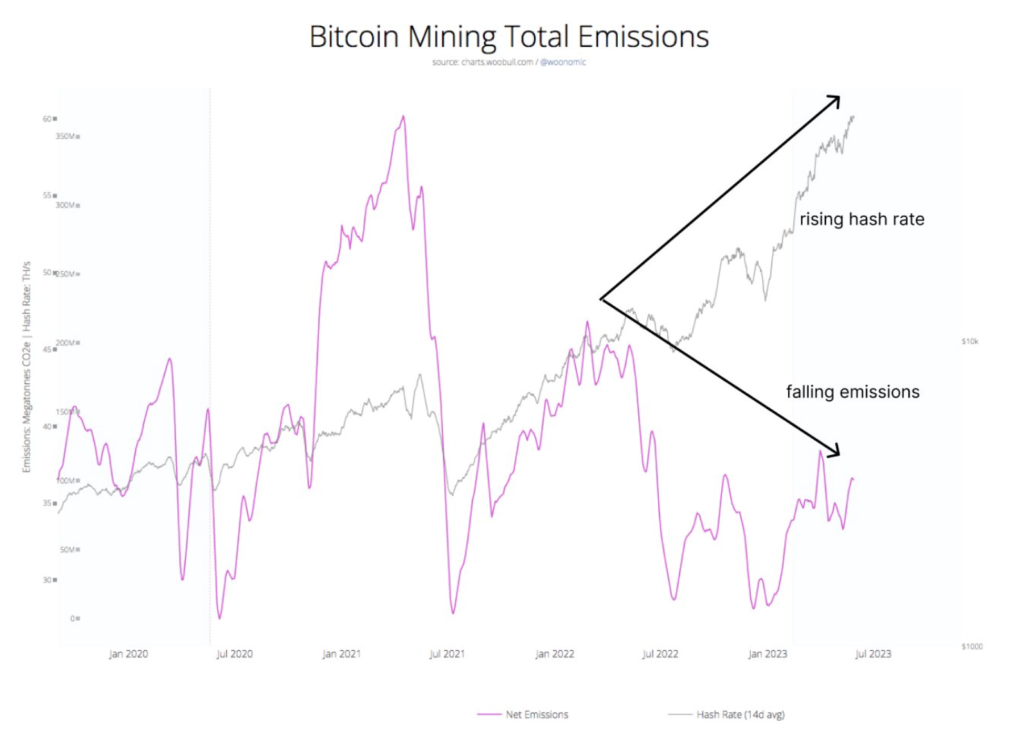
As of 9 June ’23, emissions are 34.0 Mt CO2e per year. By contrast, the CCAF emissions estimate on 9 June is 70.2 Mt CO2e, more than double the likely true figure.
Footnotes:
- CCAF deduce the above pie chart on their mining map. As we can see, Texas (ERCOT) is under-represented. The reason for the under-representation on CCAF’s part is that their mining map dataset for the US only includes Foundry Pool and many large Texas Bitcoin Miners do not use that pool. In other words, the dataset needs to be completed.