Now that we have a new model (BEEST), based on the CCAF model, with known exclusions added in, we can start asking this model some intriguing questions.
Right now, a lot of people are asking me a lot of questions based on the model. So this article is a wandering path through a number of different questions
- What % of Global Hashrate does US have?
- What is US’s contribution to the Bitcoin’s overall emissions?
- What is the most reliable estimate of Bitcoin’s energy consumption?
- Can we get more info on solar/wind/hydro as well as generally more transparency from miners?
- How do we better measure Bitcoin’s environmental impact?
US-specific numbers
No models to date have had the granularity to provide US-only data on emissions. BEEST is a bottom-up model of every significant Bitcoin mining operation in existence. It currently covers an estimated 98% of global hashrate. As such, we can do emission estimates for different countries based on a carefully calibrated understanding of how much on-grid and off-grid mining each country does.
US is currently 47.7% of the global hashrate. So that means …
roughly 47.7% of the Bitcoin Network power is consumed in the US.
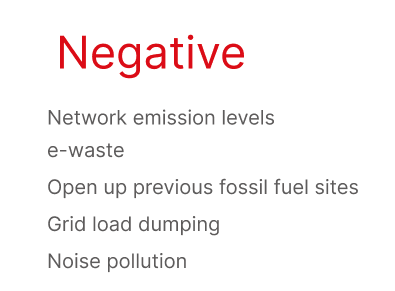
How we know: zero-rating all non-US mining activities in BEEST (Bitcoin Energy and Emissions Sustainability Tracker) we get the following data:
Summary
- US is 52.76% sustainable-energy based (similar to the current global percentage of 53.8%)
However the US has disproportionately lower global emissions. Reason: lower coal-based fuel sources compared to rest-of-world Bitcoin miners which includes China and Kazakhstan.
The US has:
- total scope-2 emissions of 13.624 Mt CO2-e
- total scope-1 emissions of -1.802 Mt CO2-e (90% of the total Bitcoin network’s negative emissions)
- net emissions of 11.822 Mt CO2-e/Yr
Total global Bitcoin net emissions are currently: 29.781 Mt CO2-e/Yr
So this means that the US has 47.7% of hashrate/electricity consumption, but generates only 39.7% of global emissions.
Who has the best Bitcoin Electricity Consumption Index?
There are currently two reliable Bitcoin Energy Consumption Indexes based on robust methodologies, CBECI and BMECI (see links below).
The total est. global electricity consumption as of 26 Feb 2023: 11.365 GW (this is the mean of the 2 most reliable estimates.
CBECI (Cambridge): 13.68 GW
BMECI (Luxor): 9.35 GWThese represent the likely upper and lower bound of electricity consumption.
So the US energy consumption figure would be 4.46-6.53 GW
Estimated value of US-only electricity consumption (at time of writing): 5.42 GW
Why does it matter?
By itself, Bitcoin Electricity Consumption is not the right metric to use, because it cannot give a read on environmental impact. For example, if all that energy were coal, it would be a severe impact. If it were all hydro, the impact would be negligible. If it were all coming from previously vented-methane gas from landfills – it would have a positive environmental impact ( 10x more positive than coal would be negative in fact).
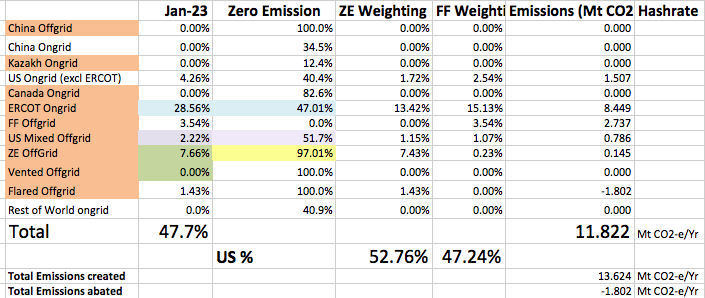
Once we combine it with our understanding of overall energy mix however, we can turn it into a meaningful number: net emissions. Higher electricity consumption will generally result in higher net emissions. Here we can see that emissions has been dropping for the last three months. The major driver for this has been the migration of Marathon Digital Holding’s Hardin coal-based plant onto an offgrid wind farm in Texas.
Note: these emission calculations relied heavily on the CBECI numbers, which we now understand to be overestimating electrical consumption. The result is that these numbers will need to be revised and will likely all come down. The overall downward trend remains in place.
These numbers above are upper limits, as they lean more heavily on the Cambridge energy consumption numbers (which tend to overestimate). The downward trend remains in play.
I’m going to stop using the Cambridge energy estimate as a sole-source going forward because I’ve seen that it is overestimating. Doing some investigation into their methodology, it uses an old and no-longer-true assumption that miners flock onto the network with older inefficient machines as Bitcoin price rises. It’s now wholesale electricity prices that have a much stronger bearing – because they are more volatile than Bitcoin. With so many Bitcoin miners now on ERCOT (28% of the world by hashrate), this has a major impact. Other grids, while not always as pronounced as ERCOT will have similar spreads.
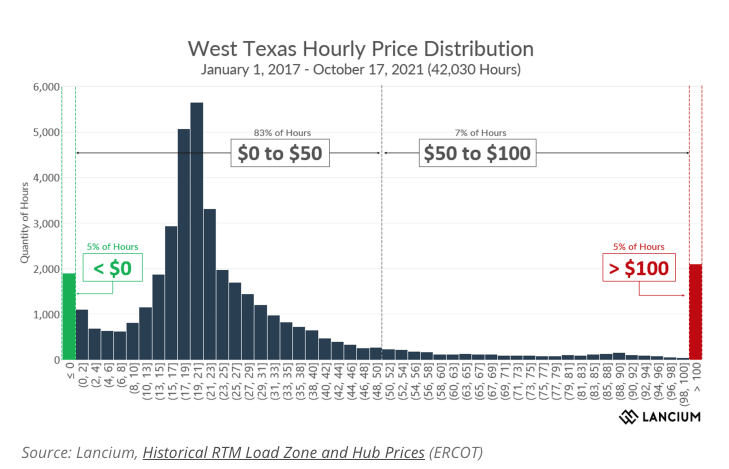
The graph above says “think Bitcoin is volatile? Check out wholesale electricity prices”
The revised model I’m building uses an average of Cambridge/Luxor – cross-referenced against a calculated net J/TH energy efficiency of the network.
What about a breakdown of solar/wind/hydro?
No model can currently do that. However, BEEST has the raw data so we could calculate it if anyone is sufficiently interested. It wouldn’t take too long.
What do we need to do to encourage miners to be more transparent?
I would like to put this misconception to rest. We actually already have very high transparency across the mining network, both in the US and internationally.
Because of the simplicity of the mining business model (almost all power used only for mining) and public nature of hashrate – we already have this data.
Reason:
Publicly traded companies represent the vast majority of all Bitcoin mining in the US.
These publicly traded companies publish monthly, or in some cases quarterly, filings which detail their total hashrate. From there, and using their breakdown of ASICS (which is also usually known) it’s a simple calculation to work out how many MW power they use. Often mining companies declare both hashrate (in EH) and power consumption (in MW)
Similarly, all large companies publish data on their energy source (grid, off-grid sustainable, off-grid sustainable with grid backup, and off-grid fossil fuel being the 4 common sources)
From there it is again straight-forward to tell exactly who is responsible for what level of emissions.
I already have this data in raw form, I just haven’t calculated it down to the mining-company level – but it would be possible to do so without more data-gathering being required.
How do we better measure Bitcoin’s environmental impact?
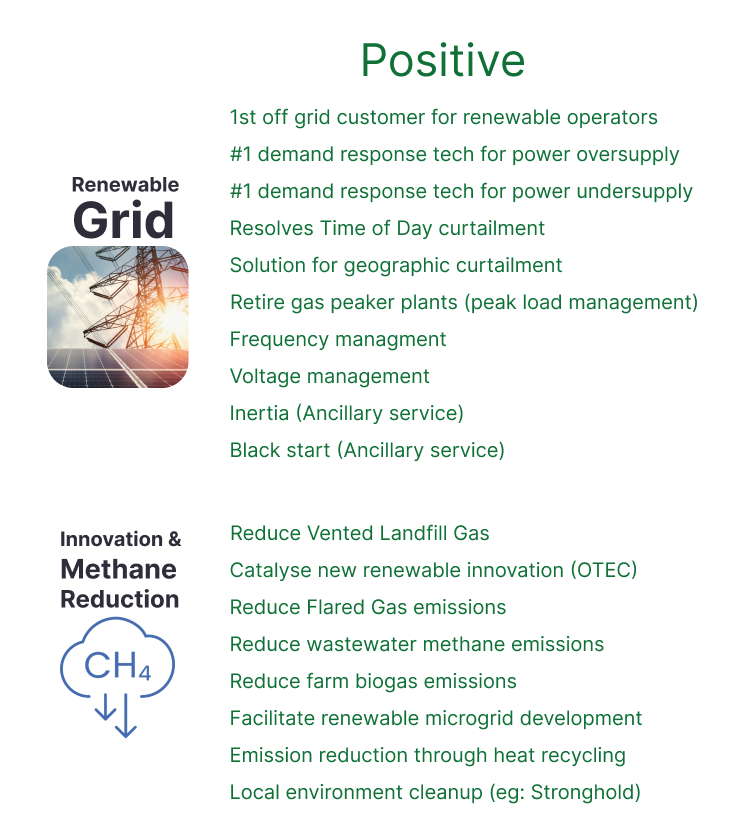
Currently, both in the media and with Government agencies, only negative environmental impacts tend to receive attention. This is an oversight. Going forward, it is important to have a balanced appraisal that considers both positive and negative environmental externalities.
We already know what these are. The next step is to quantify them. Our venture capital firm has done a weighted model, and concluded that the overall weighting of positive:negative environmental externalities is 31:1. Others should develop their own metrics and methods of quantifying these in more detail. With Bitcoin being such a new technology, the ways it is used are evolving faster than the positive impacts can currently be quantified. Because government agencies and media have historically focused only on negative externalities, these are currently more regularly quantified.