
Summary
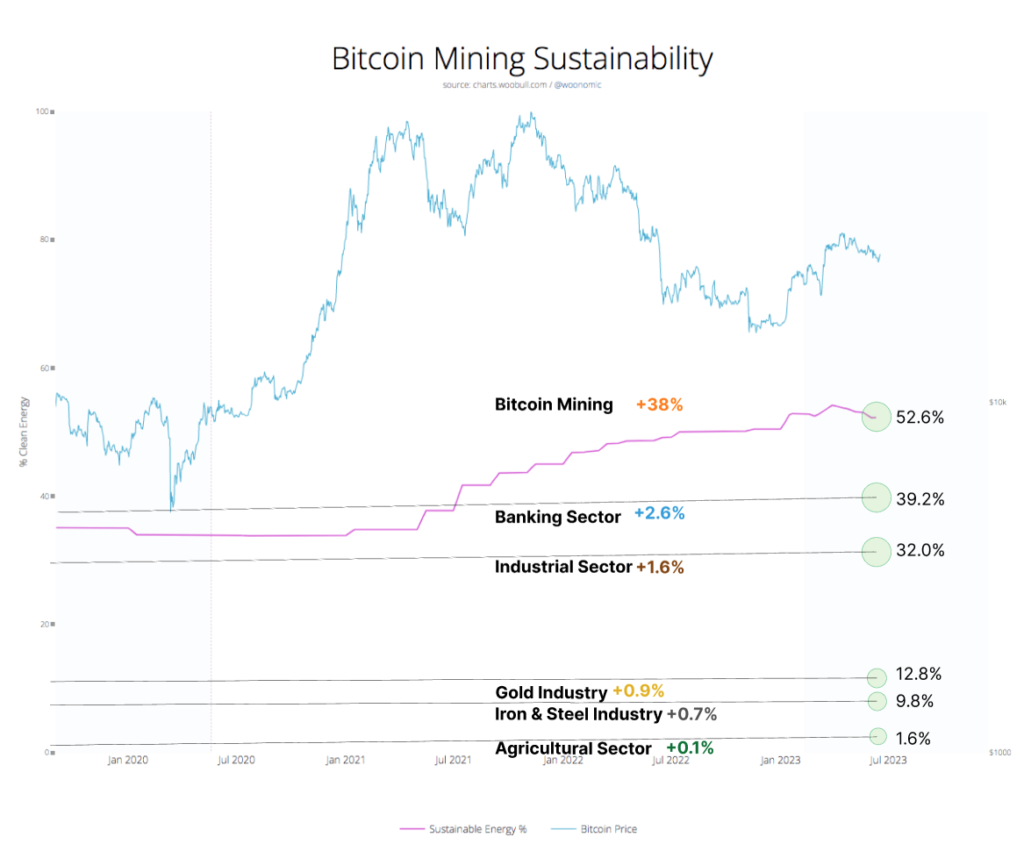
Using data from our BEEST model (Bitcoin Energy and Emissions Sustainability Tracker), and comparing to publicly available data of other industry sub-sectors, we charted sustainable energy mix over the last four years across a range of industries.
Based on the data, Bitcoin mining is currently the highest user of sustainable energy (52.6%) across sub-sectors, and has also achieved the highest increase in sustainable energy mix (+38%) during the period charted from Jul 2019 – Jun 2023 compared to other global industries.
Methodology
For electrical energy, we took the Our World in Data figure of 36.7% sustainable energy, and adjusted for the current sustainable energy growth rate, for an estimated 39.2% global grid sustainable mix. We calculate that during the charting period measured (Jul 2019 – Jun 2023), global gridmix rose 2.6% in sustainable energy use.
The “greening of the grid” is the predominant reason that industries other than Bitcoin have been able to achieve any lift in sustainable energy use.
For modelling, we assumed that industries are distributed evenly across various grids in the world, and used average electrical gridmix to calculate the percentage of sustainable energy derived from electricity consumption.
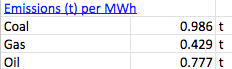
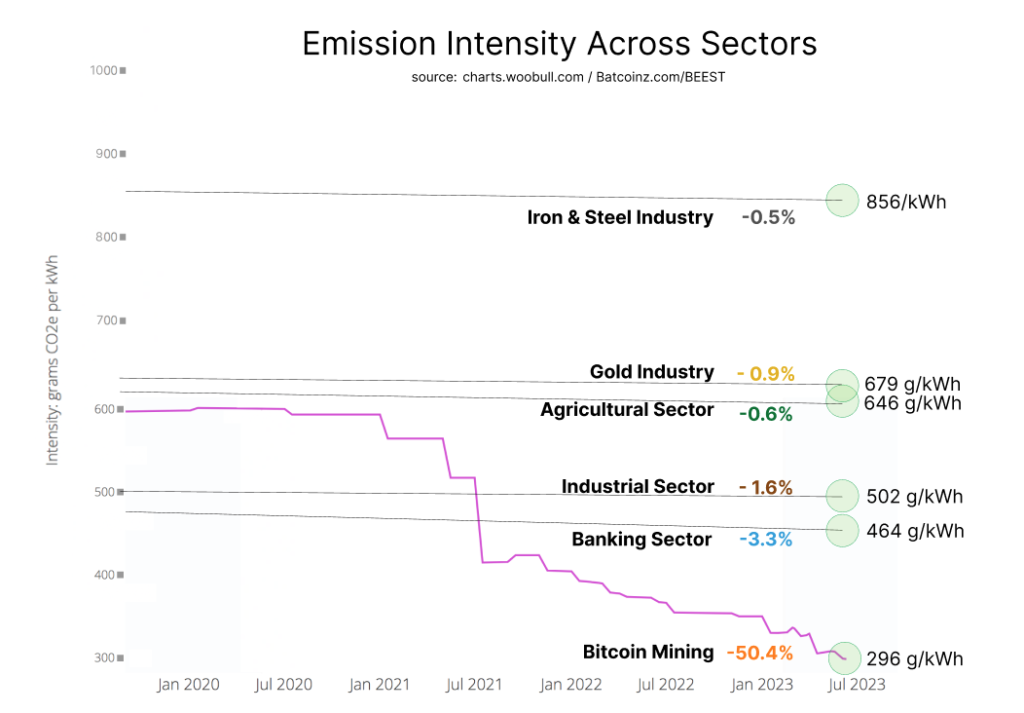
For Emission Intensity, we used the following emission intensities for fossil fuels. For all fuel sources we used emissions at generation source method to calculate emission intensity.
Banking Sector
Sustainable Energy: 39.2%
Emission Intensity: 464g/kWh
The banking sector’s energy consumption comes almost entirely from electricity used to power a network of ATMs, branches, servers, vaults datacenters and other buildings. Armored vehicle fleets make up some of the power consumption. No data was available on the contribution of non-electricity based power of the banking sector, so we assumed (generously) that 100% of the banking sector’s power comes from global grid-mix, giving the industry the same sustainable energy use, emission intensity, and respective percentage increases as the global grid itself.
Industrial Sector
Sustainable Energy: 32%
Emission Intensity: 502g/kWh
IEA found that the industrial sector decreased its reliance on fossil fuels from 72% to 68% between 2010 and 2021. It’s average rate of sustainable energy transition is therefore 0.4% per year (1.6% over the 4 year period charted).
IEA also found that “increased Electricity use was responsible for much of that decline, rising from a share of 19% to 21%” during this period.
So average change is 0.4% per year.
For emission intensity of the industrial sector, we assume the differential between the 32% renewable energy mix, and the 39.2% that would be it’s renewable energy mix if fully electrified, was made up from coal-fired sources used for pyrometallurgy.
Gold Industry
Sustainable Energy: 12.8%
Emission Intensity: 679g/kWh
The gold industry uses 67.22% non-electrical sources, 32.78% electrical power sources. Almost all non-electrical power sources were fossil fuel based. These electrical power sources assuming average global gridmix were 39.2% sustainable energy, giving the gold industry an average 0.392×0.3278 = 12.8% sustainable energy mix.
With no use of sustainable energy outside electricity consumption, the entirety of the gold industry’s increase in sustainable energy comes off the back of the greening of the grid, accounting for 2.6%x0.3278 = +0.85% higher sustainable energy use from mid-2019 – mid-2023.
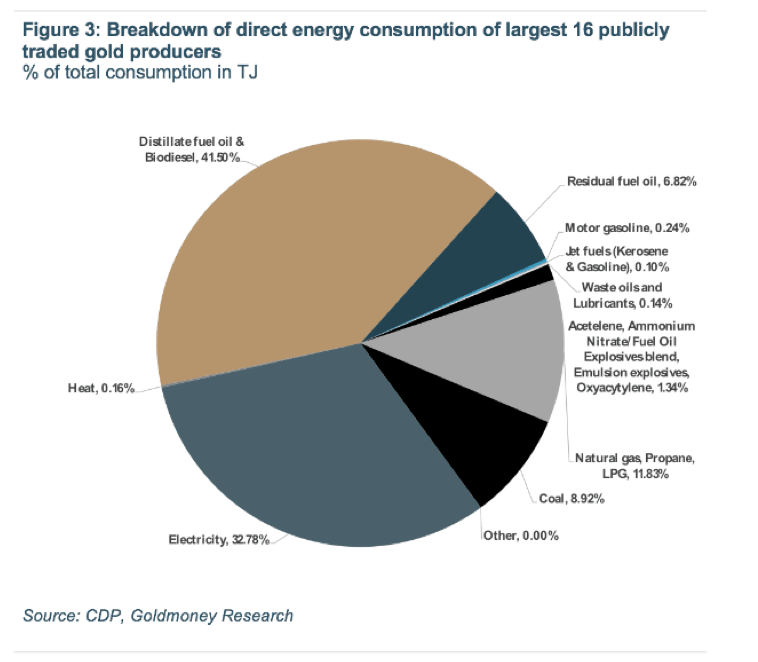
For emission intensity: the sum total of petroleum derivatives comes to 50%. We included the miscellaneous category in this total. In reality, the Gold Industry’s emissions from ammonium nitrate and explosives cause NOx and dust particles which together have a significantly higher GWP than CO2. The methodology used is therefore likely to understate the gold industry’s actual emission intensity.
For this 50%, we assumed the emission intensity of oil (0.777 t/MWh, or 777g/kWh), adding in the relevant percentages for coal and gas, then adding the percentage that comes from gridmix (emission intensity 464g/kWh) we estimate the Gold Industry to have an overall emission intensity of not less than 679g/kWh.
Iron & Steel Industry: 9.8%
Sustainable Energy: 9.8%
Emission Intensity: 856g/kWh
“Coal currently meets around 75% of the energy demand of the sector”
Assuming that the remaining 25% of the sector is powered by electricity, the sustainable energy mix of the iron&steel industry is 25%x0.392 = 9.8%. The rise in the use of sustainable energy is 2.6%x0.25 = 0.65%
For emission intensity: we take the combined emission intensity based on: 75% coal x 986g/kWh + 25% gridmix x 0.464g/kWh )
Agriculture: 1.6%
Sustainable Energy: 19.5%
Emission Intensity: 646g/kWh
Our agricultural sector calculations are the least reliable, so we opted for a likely upper bound number for sustainable energy use. Exact numbers for fossil fuel use for the agricultural sector were hard to find. However, we did learn that the agricultural sector uses mostly fossil fuels according to Seaforell.org. Subsequently, we found that only 3-4% is used for electricity, with the remainder being composed of a variety of fossil fuels (see emission intensity below). Assuming the upper bound of 4% electricity at 39.2% sustainable energy off gridmix, the sustainable energy use of the agriculture sector is 1.6%
Emission Intensity:
“Nitrogen fertilizer production uses large amounts of natural gas and some coal, and can account for more than 50 per cent of total energy use in commercial agriculture. Oil accounts for between 30 and 75 per cent of energy inputs of UK agriculture, depending on the cropping system.”
Fro our modelling, as with the gold industry, we took the approach of establishing a lowest likely bound.
We therefore assumed
- a 40%:10% gas:coal mix for fertilizer production (50% of the total)
- 4% of energy being supplied by electricity, which has a 39.2% sustainable-energy component
- oil (30-75% of the total) takes the remaining share: 46%
The estimated emission intensity of Agriculture is therefore (0.4×0.429)+(0.1×0.986)+(0.46×0.777)+(0.04×0.464) = 0.1716+0.0986+0.3574+0.01856=0. t/MWh (646g/kWh)
Revisions: 21 June: Revised down agriculture sustainable energy mix based on new research discovered, which quantied the extent of fossil fuel use of the sector, and placed the electrified component at a low 3-4%. Updated chart to reflect the revision of agriculture.