
Introduction
We are at an inflection point in Bitcoin mining history. Policy decisions made now will have far-reaching consequences. So it is more important than ever that these decisions are based on robust, complete, and up-to-date data.
The Bitcoin Mining Council (BMC) reports that the Bitcoin network uses 59.4% zero-emission* power sources. In contrast, the Cambridge Centre for Alternative Finance (CCAF) report arrives at a much lower figure of 37.6%.
Because of the significant variance, many have assumed that CCAF, an independent academic institute, must have the correct figure, whereas the BMC, an industry body, needs to be corrected.
This has resulted in the BMC data being primarily overlooked in mainstream media.
This approach, however, needs to be more scientific. We cannot believe that the CCAF study is more accurate simply because it is an independent institute. An academic institute may have a more robust methodology but still arrive at an inaccurate answer due to a lack of proximity to the industry or the exclusion of a type of data they do not have ready access.
Similarly, we cannot assume that an industry body will necessarily skew or bias data simply because it is an industry body. An industry’s professional standards may prevent this, or the data may be sufficiently positive that there is no need.
Because of the wide variance, and the importance of having robust data for a diverse group of people, we saw the need for a third study that measured both on-grid mining, but also off-grid mining (which the CCAF has disclosed do not include in their model)
“Our estimates do not account for any activities that could reasonably be expected to reduce emissions, such as using flare-gas, off-grid (behind the meter) Bitcoin mining.” (source)
Specifically, regulators and policymakers must know the following:
– Bitcoin mining’s overall % of zero-emission* energy sources
– Whether Bitcoin is trending to more zero-emission power
– Whether the Bitcoin network’s predominant energy source is coal as has been claimed in one study
Equally, it’s important for ESG investors, as it governs their investment decisions. It’s also important for environmental organizations to make robust decisions about which industries to lobby and pressure for change and how.
We designed our model to answer each of these three questions.
We’ll update this dynamic document as new data becomes available.
Findings
We found that limitations in the CCAF model result in under-reporting the zero-emission energy used by the Bitcoin network by 15.5%
(CCAF model: 37.1% vs. CCAF Model + data omitted by CCAF Model: 52.6%)
TL; DR – read the infographic below.

CCAF model limitations:
“These limitations are known to and acknowledged by CCAF. “Our estimates do not account for any activities that could reasonably be expected to reduce emissions, such as using flare-gas, off-grid (behind the meter) Bitcoin mining, waste heat recovery or carbon offsetting…we are working to incorporate these factors into future versions of the CBECI.” Source
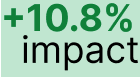
CCAF further acknowledges: “While most limitations do not have a major impact on the model’s performance, we are aware of its imperfections.” This is also true – as we can see above. Most limitations only increase the sustainable energy mix calculation by 0.31%-1.72%. The one exception is off-grid sustainable mining, which accounts singlehandedly for a 10.8% underreporting.
Further, the combined impact of excluding other factors (listed in the graph above) results in a 4.63% under-reporting of sustainable energy use, which is significant.
Key Findings of our study
– The Bitcoin network now uses a minimum of 52.6% zero-emission energy
– The Bitcoin network uses +4.49% more zero-emission power each year
– The inference that the Bitcoin network has coal as a primary power source is incorrect. Instead, the Bitcoin network appears to be one of the few industries that do not have coal as its primary energy source
Our overall zero-emission energy figure is 7.2% lower than the BMC data for reasons we will investigate in the body of the report; however, it is significantly higher than the September 2022 CCAF report, which found that:
– The Bitcoin network used 37.6% zero-emission energy sources
– This had decreased slightly since before the China-Ban
– The primary power source for the bitcoin network was coal
Source of variance with CCAF
As stated, the CCAF report does not include either off-grid mining or flared-gas mining. We had already quantified the flared-gas percentage of the Bitcoin network to be relatively minor (1.3%).
However, we hypothesized that the off-grid proportion of the Bitcoin network was significant and highly skewed to renewable energy. This thesis proved to be correct and is summarized in the diagram below.
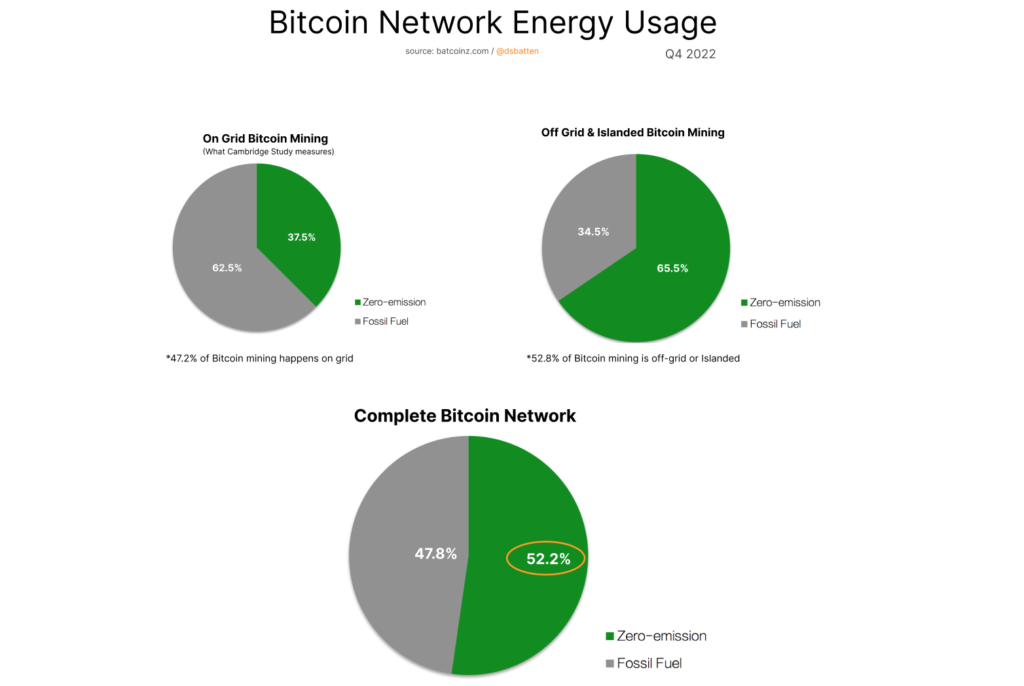
Using the CCAF methodology, we were able to almost precisely replicate their zero-emission calculation (37.08% vs the CCAF figure of 37.6%) We then step-added both off-grid and flared gas mining operations that we had verified the accuracy of (see methodology). The resulting model reflected a new and (relatively) complete view of the Bitcoin network.
CCAF has it on its agenda to add these components. Currently, they are working on building a model for another form of alternative finance currently. Their update is therefore unlikely to be ready until the latter part of 2023.
Until their model is updated to factor in off-grid and flared-gas mining, we offer this model as a more complete and up-to-date view of the Bitcoin network.
Coal Based Electricity ?
In making a statement such as “this technology uses predominantly coal” it is important to also make it clear that any technology using grid electricity for power in locations around the world will also “use predominantly coal”
This reflects the underlying way that today’s electrical grid generates its power.
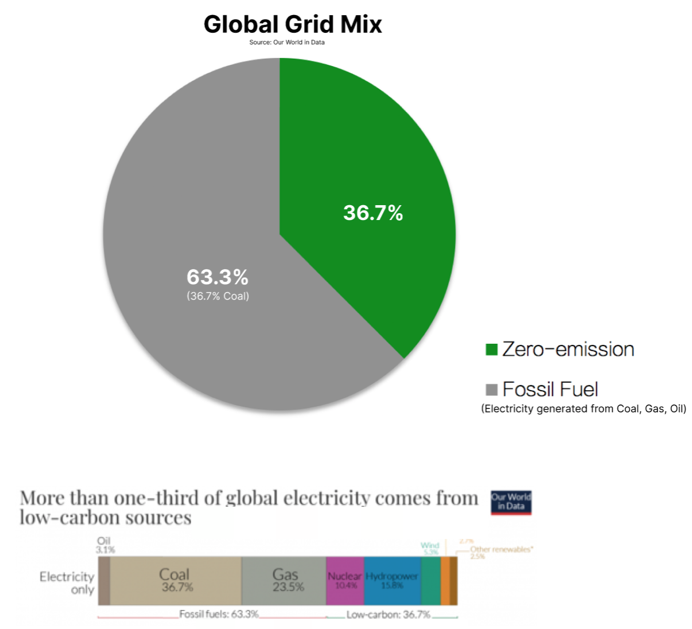
What is interesting about the global grid-mix to us is that the zero-emission percentage (36.7%) closely matches both our calculation for the on-grid portion of the Bitcoin mining network (37.5%) and CCAF’s (37.6%).
This is important, because some critics have in the past claimed that Bitcoin uses grids that tend to be more coal-based. Both our data, and CCAF data, does not support this hypothesis.
This shows the importance at looking at full data sets rather than cherry-picking isolated examples; a method which is not only statistically invalid, but also which risks supporting the confirmation bias of the person doing the picking.
Due to its mobility, Bitcoin mining is one of a rare few industries that can base most of its power usage off-grid. For this reason it would appear that contrary to the findings of the CCAF report, Bitcoin mining is one of the very few industries that does not have coal as its major power source.
Detailed Breakdown of major factors impacting CCAF model accuracy
By far the most important factor is off-grid sustainable mining, so let’s start there, and work down the list.
1. Off-grid sustainable mining
on the actual percentage of sustainable energy usage of the Bitcoin network. In other words, this factor by itself lifts the sustainable energy calculation from 37.1% to 47.9%.
The single largest factor in the variance is the inclusion of off-grid zero-emission mining. The Mining companies represented below represent 14.28% of all hashpower.
The Cambridge model bases their renewable energy use on the grid they reside in (typically around 30-40% throughout the world, unless located in a majority renewable grid such as Norway or Canada). However, the average zero-emission energy use of these mining organizations is a considerably higher figure of 96.96%.
Together with off-grid hydro-powered zero-emission mining operations in China, the impact of adding these 31 mining groups (listed below) into our model is a 10.8% rise in the amount of zero-emission energy used by the Bitcoin network.
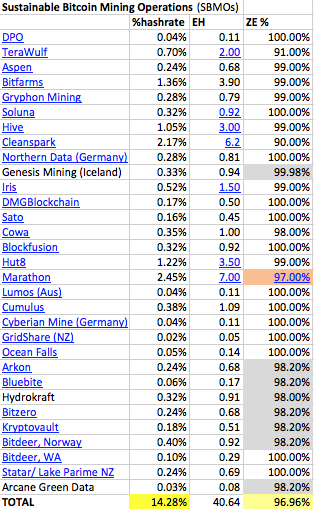
There are a further 10 sustainable mining companies using flared methane (emission negative) as a power source, covered in 5. below. This means that collectively there are 41 sustainable-energy-based mining operations.
2. Kazakhstan Exodus
In most cases, the use of a 13-month-old mining map does not significantly influence model accuracy. The one exception is Kazakhstan because
a. Kazakhstan has a heavily fossil-fuel-based grid
b. There is strong evidence that significant, quantifiable hash rate has migrated from Kazakhstan since Jan 2022
The impact of these points is expounded upon in detail in my 25 Jan 2023 Bitcoin Magazine article.
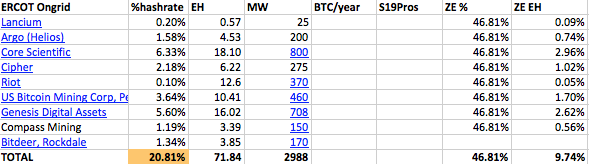
3. CCAF model significantly underestimates the amount of Bitcoin mining happening off the ERCOT grid
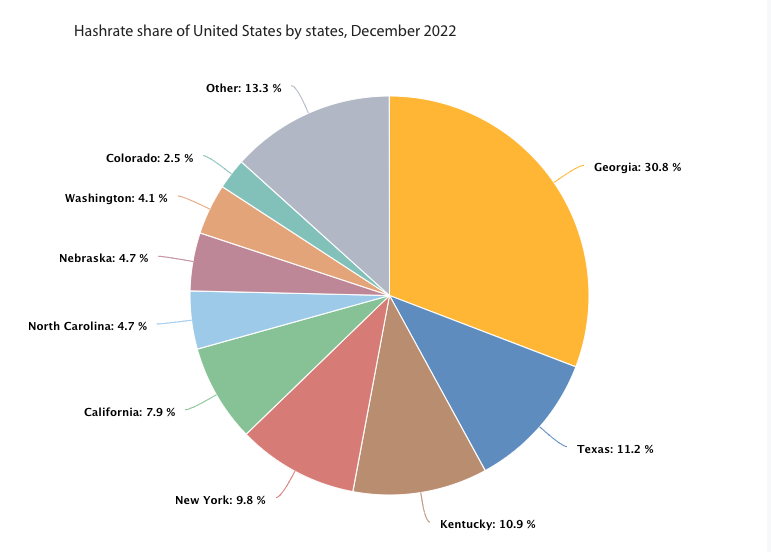
How we know: CCAF deduces the above pie chart on their mining map. As we can see, Texas (ERCOT) is under-represented. The reason for the under-representation on CCAF’s part is that their mining map dataset for the US only includes the Foundry Pool and many large Texas Bitcoin Miners do not use that pool. In other words, the dataset is incomplete.
Our own bottom-up calculation of ERCOT-based mining hash rate tells us that these miners represent 20.81% of the global hash rate (see below) and 56.22% of all US hash rates.
This under-representation of ERCOT matters because ERCOT has a meaningfully higher clean-energy percentage than the National Grid (46.8% for Texas vs 40.3% for US).
4. Marathon Renewable Migration
In January 2023, Marathon confirmed they had completed the migration of their 100MW Hardin, Montana Coal-powered data-centre to a wind-powered operation in West Texas and completed other renewable migration projects. I was in touch with the executive team at Marathon who confirmed that they use ERCOT power when there as backup.
5. Use of Flare gas
I covered this in some details in previous research, where we found that there are 9 mining operations using flare-gas (down from 10 due to the acquisition of GAI by Crusoe Energy). These 10 operations collectively account for 168 MW of sustainable (and also carbon negative) energy.
6. Off-grid mixed
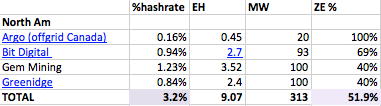
This category refers to off-grid, or partially off-grid mining organizations using a mixture of fossil-fuel and sustainable energy sources. Because these mining organizations have an overall sustainable energy usage of only 51.9%, the extent to which they increase the overall percentage of sustainable energy above the CCAF estimate is small.
7. Greening of the Grid
Our World in Data calculates the amount of energy sourced from each energy type, for each year, both by jurisdiction and globally. From there we can calculate a 5-year rolling average of how fast the global grid is moving towards sustainable energy.
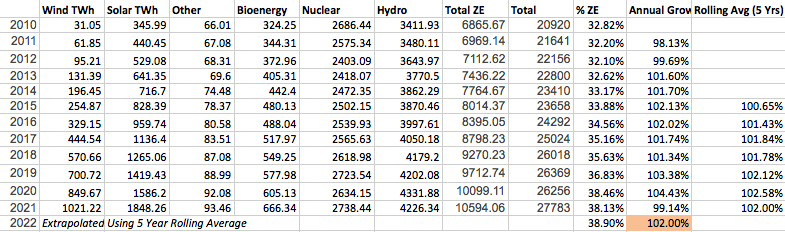
Electricity Reviews (2022). Annual Growth and Rolling Avg Calculations mine.
It turns out that the global grid has 2% more sustainable energy on it every year. This would have been higher, but for the impact of COVID in 2021. This data allows us to get a more accurate, up-to-the-minute estimate of any technology’s sustainable-energy mix which uses the grid.
8. Off-grid Fossil Fuel
The CCAF report also does not factor in off-grid mining operations that are using exclusively or almost exclusively fossil-fuel sources. There is currently only one mining operation in this category, which has a small net-negative impact on the sustainable energy profile of the Bitcoin network.


9. Update for current hash/power
Since the CCAF study was taken, both hashrate (Glassnode: 1 hour chart, 168hr SMA) and the Energy Consumption (Cambridge Bitcoin Energy Consumption Index) have increased. This has had a non-trivial downward impact on the overall sustainable energy mix.
Why is this figure lower than BMC ‘s figure of 58.9% ?
There are two likely reasons for this:
- I have used realised hashrate, whereas with self-reported data it is more likely that BMC’s numbers include instances of theoretical hashrate. The impact of this is the BMC numbers may marginally overstate green hashrate
- I have used a lower limit calculation. What that means is that in some cases I may be understating actual green hashrate. For example, available data suggests Kazazkstan’s hashrate is 6.44%. There is some evidence that hashrate is now significantly less than this. But in lieu of verified reports that confirm quantifiable hashrate or megawatts of energy migrating off the network, I have used the higher estimate.
So it’s likely that 52.6% is slight understated, BMC is marginally overstated and Bitcoin’s actual sustainable energy proportion is ~55%
BEEST MODEL Methodology
Overview: What we did
- Use Cambridge (CCAF) baseline to calculate the ongrid portion of the network, and for information on where miners are geo-located
- Add in exclusions that Cambridge acknowledge are not accounted for in their model
- Offgrid mining
- Flare and vent-gas mining
- Update for when hashrate has changed quantifiably in a country since the last iteration of the Bitcoin Mining map (Jan 2022)
- Add in exclusions from Cambridge model not explicitly mentioned as exclusions on their website
- Reflect increased renewable energy composition of on-grid electricity
- Improve accuracy of ERCOT estimate, by using a bottom-up measure of all miner activity instead of the CCIF estimate based only on FoundryPool data, which is not a pool used by the majority of ERCOT miners
- Update for other factors that influence sustainable energy mix since the last CCAF measure, namely:
- Update for latest estimated energy consumption and hashrate
- Update to reflect mining activity that has transitioned from one energy source to another (eg: Marathon Digital Holdings in Jan 2023)
- Transition model from an energy-consumption based model (less accurate, as energy consumption is unknown and must be estimated) to hashrate based model (highly accurate, as hashrate can be precisely and dynamically calculated)
Details: How we did it
- Start with CCAF model and mining map.
Reproduce using Our World in Data grid-mix data for each nation’s national grid. Because we used a different data-source for grid-mix, we arrived at a substantially similar but slightly more conservative base-estimate of sustainable Bitcoin mining.
CCAF estimate of on-grid mining – acknowledging known exclusions: 37.6%
Our estimate of on-grid mining excluding flared emissions and other exclusions: 37.1%
Impact of variance: If our source data is more conservative in its aggregation of sustainable energy, our model may slightly understate the overall sustainable energy usage of the Bitcoin network.
The likely reason for the slight variance is that they use a more granular province-by-province approach for estimating Chinese renewable energy statistics. In this instance, the more granular direction of the two is clearly the better approach. When time allows, we will replicate this approach. The likely result will be another slight increase in the percentage of sustainable energy use of the Bitcoin network. As our intention with this model was to provide a lower bound estimate, we deemed it unnecessary in the first iteration of the model to use province-by-province data for China.
2. Add in CCAF-disclosed exclusions
2. We used an extensive bottom-up approach, contacting every known on-grid and offgrid miner on the network. We gathered their hashrate. Where hashrate was not available we extrapolated hashrate based on their known energy usage and an estimate of miner-mix used to mine Bitcoin.
Based on known location, we then subtracted their hashrate from the country’s hashrate as gathered from the CCAF mining map, thus progressively nuancing the model with more granular data.
In the case of US we were able to fully replace the base CCAF-country estimate with a granular bottom-up estimate using actual miner data, fully replacing CCAFs aggregated, assumed-ongrid pool-data.
In the case of other nations such as Canada, where the combined hashrate through granular gathering of data, miner-by-miner, was less than the CCAF mining map estimated hashrate for that country, we assumed that the remainder of that country’s data was coming from ongrid electricity of that nation.
We used “Our world in Data (BP)” grid data for each country to then calculate the sustainable energy portion of those remaining mining companies.
We used a combination of
– Publicly disclosed filings (typically for large publicly traded mining companies)
– Direct contact with mining companies where we gathered disclosures on hashrate, machine composition, energy use, energy source and uptime
– co-operation with other data-quants in the Bitcoin ecosystem who had pre-verified mining data available (esp. Arcane research)
Note – number of miners who refused to disclose data: 0
We then discounted hashrate based on the following uptime calculations
- Other Bitcoin mining companies: 98%
- Flared gas: 90%
- ERCOT-based miners: 94% (ERCOT has a low uptime figure due to participation of Bitcoin mining companies in demand response programs that result in hashrate curtailment)
2a. Offgrid mining total
We divided offgrid miners into 3 categories (associated totals are snapshots as of 21 Mar ‘23)
- Offgrid Fossil Fuel (4 mining companies found – 3 gas, 1 coal-ash, 0 coal): aggregate hashrate: 11.21 EH using 0% sustainable energy
- Offgrid Mixed (4 mining companies found): aggregate hashrate of 7.83EH with average sustainable energy use of 59.5%
- Offgrid sustainable energy sources (33 mining companies found): aggregate hashrate: 53.96EH with average sustainable energy use of 97.06%
2b. Flare and vent-gas mining
We used the 168.35 MW of flare gas mining uncovered in the prior research paper: Quantifying the Emission Negative Component of the Bitcoin Network, we extrapolated hashrate dynamically based on changes in hashrate using the 1hr chart, 168hr SMA (source: Glassnode). We then used the mathematical conversion factor outlined in the same paper to calculate total emissions mitigated.
We then repeated the above approach for the nascent vented-methane Bitcoin mining sector.
2c. We updated hashrate as a % of network for countries that had instituted bitcoin mining bans, or partial-bans, post Jan-2022 (when CCAF paused updating its mining map). We used the absolute hashrate of each country as of Jan-2022, and recalculated %-of-global hash based on current dynamically changing hashrate. Assumption: China and Kazazkstan due to “unfriendly” central government policy has not had new entrants into mining since Jan 2022.
We then used official government news reports of Kazakhstan to estimate
- seizure of mining equipment (in terms of total MW capacity) in Jan-Mar 2022
- lose of Bitcoin-mining time through enforced curtailment of electricity to bitcoin miners in Q4 2022
We assumed a low total of mining in Kazakhstan is legal (50%) so as not to over-state the impact of ii. above, then re-estimated Kazakhstan’s current % of global hashrate.
3. Add in remaining CCAF-model exclusions
3a. One of the problem with grid-mix data is that with the rate that the grid is transitioning to sustainable energy sources, a figure from 18 months ago may no longer be accurate. We overcame this by using a backtrace of global grid-mix data for each nation (source: Our World in Data).
We then calculated the rolling 5-year average rate at which new sustainable energy enters the grid. Using this we estimated how much new energy enters the grid each year. We then broke this down further to estimate daily changes to the global grid to reflect a dynamic realtime estimate of on-grid sustainable energy.
This improvement in estimated real-time accuracy made a small yet not insignificant +0.3% difference to our overall sustainable energy calculation.
3b. ERCOT data
We used the same approach described above to estimate realtime sustainable energy percentage of the ERCOT grid. We then gathered data from all known miners using the ERCOT grid and then sanity-tested this by cross-validating aggregated data against expert estimates of total aggregated Bitcoin mining data (3 GW).
Using this bottom-up approach, we found 10 major mining companies using the ERCOT grid. Collectively they use 3.258 GW of power. However, due to participation in Demand Response programs, likely uptime is 94%, meaning an average power usage of 3.06 GW.
As of 21 Mar 2023, they represent 26.13% of total hashrate after participation in Demand Response programs is factored in
4. Upon updating energy consumption, we noticed anomalous behaviors in the CCAF CBECI energy consumption index data. For example, when Bitcoin price tracked up marginally without an accompanying rise in hashrate, the CBECI index tracked higher than we would have expected.
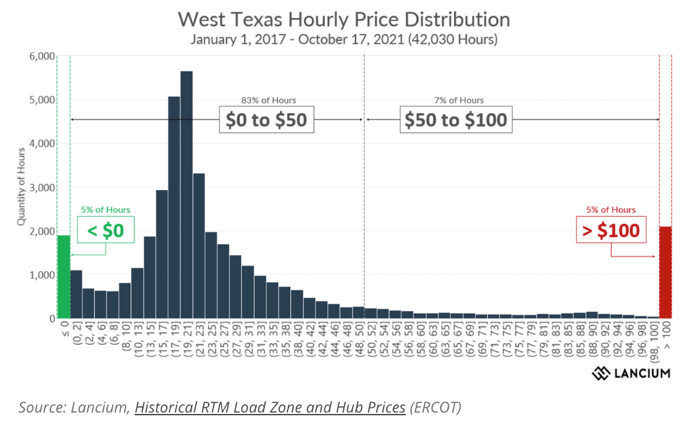
Examining the CBECI methodology, we realized that it was using the assumption that Bitcoin price was the bigger driver of miner activity, causing more inefficient miners to come onto the network. While this is true to some extent, it is not the primary driver of miner efficiency. Today, this is driven much more by wholesale electricity prices (which in ERCOT for example, have much higher volatility relative to Bitcoin price volatility).
At some stage we will publish a separate paper proposing a new way to estimate energy consumption based on current miner behavior. In the interim, we are using a hybrid approach which averages CBECI’s estimate with Luxor’s BMECI energy consumption estimate.
Because the bulk of our model is hashrate-derived rather than power-consumption derived, this does not have a major impact on overall model performance.
4b. Marathon migrated their final 100MW of non-sustainable energy from the Hardin, Montana facility to West Texas wind-farm. The completion of this migration was announced 26 Nov 22. We reflected this in the model by adding Marathon to renewable-based mining. We also contacted Marathon directly to ascertain the % of the time that they required ERCOT grid-backup when their off-grid wind-farms were producing insufficient power.
5. Hashrate-based model
We further enhanced model accuracy, by replacing model reliance on estimates (energy consumption) with reliance on quantifiable real-time data (hashrate), only using energy estimates for mining companies when no hashrate data was available for that model.
Over time, we will progressively improve model accuracy further by replacing remaining energy-based calculations with hashrate-based calculations.
Other information on methodology
As expected, large publicly traded mining companies had the most considerable portion of off-grid usage.
These companies included Argo (partly on-grid, partly off-grid) and Marathon (fully vertically integrated off-grid).
CCAF research states that China represented 21.1% of the network in Jan 2022. In our previous report on mining since the China “ban,” we provided the case that most of this is now off-grid hydro. However for model estimates, and in lieu of reliable data on Chinese based mining operations, we have assumed that Chinese mining companies have simply maintained their proportion of hydro-based mining.
Stronghold uses 165 MW of power from fossil fuel sources at the time of writing.
The Zero-emission off-grid portion included Cleanspark, DPO, Terawulf, Blockfusion, Aspen Creek, Bitfarms, Gryphon, Soluna, Hive, Cowa, Sato, Genesis, Iris, Hut8, Northern Data, DMG Blockchain, Cipher.
Further commentary on field-research approach
Field research process took 6 months, during which time we identified 42 mining companies of significance. In the 9 months since the initial model was created, we discovered more mining companies of significance and have been progressively adding them to the model as their power draw and exahash rating gets verified.
Aside from starting with the Cambridge on-grid model, our approach differs from BMC in two other respects
– We have used publicly verifiable data rather than self-reported data
– We have investigated mining companies across the network to avoid the risk of having asymmetric visibility toward only BMC members
Because we are using a “complete” on-grid and off-grid mining model, where we identified off-grid mining, we took into consideration their geographic location in each instance to avoid the possibility of double-counting
Field research is statistically simple but laborious. As such, we could use simple statistical tools. This had the advantage that we could use tools that laypeople are familiar with (Excel) for our calculations. Once we have recovered from the late-nighters getting this report ready, we look at how best we could open-source our approach and offer others the chance to edit and validate the entries of collaborators in much the same way Wikipedia works. This community-owned model could evolve in accuracy faster than any model developed by a single research group.
Wherever possible, we gained actual hashrate data of each mining company. Where this was not possible we calculated hashrate using their power (MW) and mining rig information.
Where mining rig information was not available we inferred their hashrate through the best estimate using their date of site establishment and likely mining rig composition (in most cases S19Pros)
Field research involves using various strategies to gain information, including looking at public filings/websites/news articles, email, and in several cases, direct conversations with mining company representatives.
Lower bound level focus
Wherever there were grey areas, the model assumes the scenario that paints the least sustainable result for the Bitcoin network. For example:
- When coal-based mining ended in China, we model the scenario that 100% of that migrated on a grid. We know numerous anecdotal examples of this activity migrating into new off-grid micro-hydro, which has a much higher renewable energy mix. However, in the absence of quantifiable evidence of how much of this sort of new off-grid micro-hydro mining exists, we have excluded this until reliable data becomes available and assumed 100% migration to the grid.
- Calculations and estimates suggest that Kazakhstan’s current proper mining level is under 3% of the global hashrate. However, until reports are verified, we have used the higher calculated figure of 6.44%. Due to Kazakhstan’s heavy reliance on coal, this again paints the Bitcoin network as slightly more carbon-intensive than it likely is.
Other applications of the BEEST model
Because the BEEST model assesses each mining company based on their energy source, in addition to sustainable energy mix, we can also use this model to assess and chart
- total emissions and net emissions of the Bitcoin network. As of June 15 2024, we estimate that net emissions of the Bitcoin network are 45.04 Mt CO2e.
- emissions mitigated (through use of flared and vented methane). As of June 15 2024, we estimate that 7.45% of the Bitcoin network is methane mitigation.
- emission intensity of the Bitcoin network. As of June 15 2024, we estimate the emission intensity of the Bitcoin network to be 238.6g CO2e/kWh
- emissions per dollar of market cap of the Bitcoin network. As of June 15 2024, we estimate the Bitcoin network to generate emissions of 32.24g CO2e/kWh.
The links above refer to links to charts which map each measure in real time, using raw data from the BEEST model, which is publicly viewable here.
Together, these charts provide us with a model that builds up the Cambridge model, but which is both more complete and more up-to-date compared to Cambridge’s model.
Further analysis into improvements we have made to the Cambridge model, and quantification of inaccuracies in the Cambridge model can be found in this paper which explains how we arrived at an improved estimation of Bitcoin network emissions.
Exclusions
One of the criticisms of Bitcoin mining organizations from environmental groups is the claim of offsets in their net emissions reporting. Another criticism has been locating near renewable energy without a contractual agreement and claiming to use renewable energy rather than a grid mix.
We did not factor in offsets in our emission calculations and excluded adjacent-non-contractual miners from our pool of off-grid miners.
Similarly, we excluded RECs from our calculations, so the model follows a similar methodology as CCIF (based on physics rather than carbon accounting). We recognize the value of developing a second model in the future which calculates the impact of both RECs and offsets. This is outside the scope of the current model.
Model Limitations
While most limitations will not significantly impact overall model performance, we are aware of its imperfections. In most cases, restrictions will result in a slight underestimation of the broad portion of renewable energy used by the Bitcoin network.
We will continuously improve the model as more off-grid information becomes available, and a clearer picture of Kazakhstan hashrate and China grid-mix percentage emerges.
However, because we can only add new offgrid mining operations as we discover them and verify their energy mix, it is likely that there is still a considerable amount of offgrid Bitcoin mining that we have not yet factored into our model. We found that offgrid mining is more heavily weighted towards sustainable energy sources. Combined, these two factors suggest that our model is likely underestimating Bitcoin mining’s current sustainable fuel mix by up to 3%.
Other limitations:
– Additional mining companies not known about (For example, in our field research we discovered two companies that were entirely off the radar and wished to remain anonymous. These tend to be smaller operations, often using harmful carbon sources (flared gas) as these two were.
– Mining companies that have added additional hashrate without being reported in the media. As off-grid mining uses 65.5% zero-emission energy sources, this may result in under-reporting the zero-emission component
– Network hashrate is constantly changing, so the picture of the network is also dynamic and constantly changing
– In some cases, we encountered inaccurate information reported on miner websites. For large mining operations, we cross-verified this information; however, as we investigated 42 miners, we did not cross-verify mining operations under a hashrate of 0.2 EH/s.
– In some cases, EH figures were unavailable, only the amount of MW the mining company used. In these cases, we needed to make assumptions about the TH/s and Wattage of their mining rigs based on their purchase date (we anticipate that this
– Net emissions reduction of flared/vented methane mining not factored in. Using methane that would have been atmosphere bound is regarded as an emission-negative power source (better than zero-emission). We have not factored this into the model, treating this type of mining in the same bracket as renewables. In future models, we will transparently reflect the net impact of this type of mining on overage network emission status.
– China: As well as screening publicly available information and Cambridge’s data, we did our field research involving owners of mining operations in China. We conclude that over half of China’s hashrate comes from off-grid hydro. However, we have based our calculations on marginally over 1/3 of hashrate coming from off-grid hydro sources (corresponding to the peak part of the wet season only)
– When it was unclear whether a miner was on-grid or off-grid, we categorized them as on-grid. The model may therefore underestimate the actual number of off-grid mining operations.
Terminology
Zero Emission: sources of power that are not considered to create emissions as part of electricity generation. This includes solar, wind, hydro, geothermal, other renewable, and nuclear.
On-grid: Bitcoin mining operations that use the electrical grid of that jurisdiction to mine Bitcoin
Off-grid: Bitcoin mining operations either own their power plant (vertically integrated), have a contractual agreement with the owner of a generation facility for the supply of electricity, or mine directly from a power source that is converted into electricity (such as vented methane, piped into a generator)
Footnotes:
* Our model uses a dynamic grid calculator that considers the last known renewable energy % calculation and the speed at which a given grid is evolving towards renewable energy based on past growth-rate. For example, ERCOT had 42% sustainable energy sources as of April 2021. Based on our calculation of ERCOT renewable growth, we estimate ERCOT to use 46.81% sustainable energy as of Feb 2023. By contrast, the US grid data is 40.3% from sustainable sources (adjusted for growth rate from Nov 2022 data).
- This data and this study is independent, and received no funding from Industry.
Document Revisions:
1 Feb 2023
I have added a comprehensive Breakdown of all sources of variance between the CCAF model and the BEET model (Bitcoin Energy and Emissions Tracker). In particular: separately analyze the impact of off-grid sustainable mining and ERCOT mining.
Revised Zero Emission miner data table graphic based on the latest available data
Updated model statistics based on the latest movement in hashrate and power consumption and other new data, including Kazakhstan’s further hashrate reduction and Marathon migration off Hardin coal-based power generation facility
13 Feb 2023
Added ERCOT detailed breakdown, latest infographic, and Breakdown of the minor exclusions from the CCAF model
28 May 2023
Added link to raw data file, making the BEEST methodology and raw data fully transparent.
4 July 2023
Added ERCOT wholesale electricity price volatility chart, to help illustrate how wholesale power prices are significantly more volatile than Bitcoin price.
15 June 2024
Updated raw datafile.